


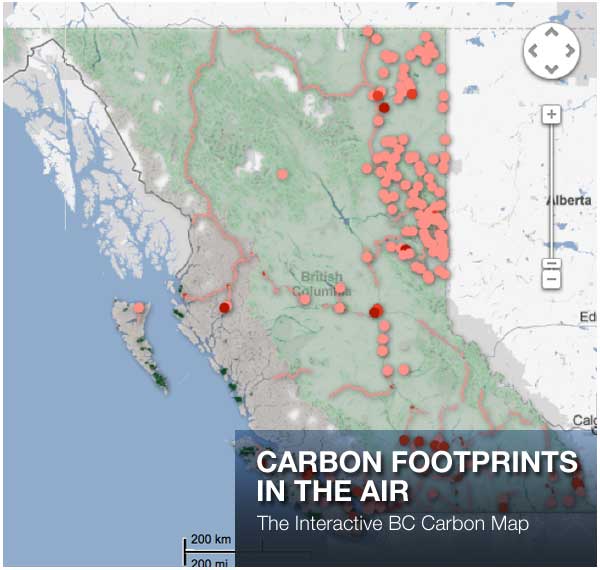
[Editor's note: Yesterday The Tyee published a Tyee Solutions Society map of British Columbia that, possibly for the first time, shows our collective carbon footprint (see above). The map is interactive, which means you can turn sources and sinks on and off. We invite you to use the options to imagine how different choices can lead to different outcomes. For an in-depth discussion of the data sources, see this companion story. ]
The B.C. interactive carbon map is the Tyee Solutions Society's first attempt to visualize the choices British Columbians face in confronting climate change. Our idea was to put British Columbia's most important carbon sources (emissions to the atmosphere) and carbon sinks (removals from the atmosphere) on the map -- literally -- along with the ability for viewers to see what our carbon "bottom line" might look like if some of those weren't in the picture.
To that end we sought out the most credible data available to quantify the most important currents in B.C.'s carbon "flux" -- the scientific term for the net difference between carbon dioxide released into the atmosphere from all sources, and carbon dioxide removed from the air and sequestered in stable carbon stocks (typically in plants or organic matter). The goal and, with some important qualifiers, the result is a rough carbon balance sheet revealing the interplay of emissions and ecosystems at scales from the provincial to the local.
Getting to that result however, was a journey in itself. During the course of the project we discovered that there is a very great deal of raw data out there, and yet very little certainty about what it all adds up to for the current state of our provincial atmospheric carbon flux -- or the future outlook. In the words of our stoic GIS mapper, Hugh Stimson, the project became, "an illustration of data, and an illustration of a lack of data."
Not counted
One of the biggest holes we found was in what provincial authorities tally as they count up our greenhouse gas emissions. According to the latest 2010 provincial data, B.C. emitted 62 million tonnes of "C02 equivalent" (a metric measure used to aggregate emissions from various greenhouse gases with different global warming potentials). But if we include emissions generated by the coal and natural gas we export, that number nearly quadruples, to as much as 240 million tonnes.
Environmental accountants in Canada and elsewhere argue for just such more inclusive accounting of emissions caused by exported commodities. Their impact on our carbon footprint can be dramatic. Take coal: B.C. mines produced over 26 million tonnes of it in 2010, most exported to Asia for use in making steel. If we accepted responsibility for the emissions from just that coal (roughly 64 million metric tonnes of C02), our official estimate of 2010 climate emissions would nearly double.
B.C. is similarly selective in accounting for emissions from generating electricity. The province currently does not account for emissions represented by the megawatts of fossil-fuel-generated electricity that B.C. Hydro buys from Alberta. The Crown utility typically makes the purchases during non-peak hours, when the Alberta juice is priced at rock-bottom, while selling clean, B.C.-generated hydro-electricity to California (where utilities must meet strong renewable supply standards) at a profit.
Researchers at the University of British Columbia calculated that distributing such dirty imported coal-fired electricity to consumers almost quadruples the actual carbon footprint of every kilowatt-hour they use. The official provincial estimates we rely on here don't capture those "upstream" emissions.
On the other hand...
We ran into new questions when we attempted to visualize where B.C.'s carbon "sinks" sequester emissions.
The Carbon Tracker Project, a U.S. government-led effort to measure the interplay of carbon sinks and emissions on a global scale, has concluded that between 2001 and 2010, ecosystems in North America offset about one-third of the emissions from fossil fuels burned in the U.S.A., Canada and Mexico combined.
But the amount of CO2 taken up by the biosphere can vary significantly from place to place and year to year. In 2002, when drought and forest fires ravaged much of the southwestern United States, researchers recorded a big decline in annual uptake by terrestrial ecosystems (on a map like ours, the green "sink" areas might have shrunk, turned neutral grey, or even into pink-ish "sources").
This raises a troubling prospect: the worse climate change impacts become for natural ecosystems, the less we can rely on our biosphere to sequester carbon.
That may already be happening. When we began work on our project, we hoped to find that B.C.'s vast forests would be an important carbon sink, busily turning atmospheric CO2 into stems, branches and roots. We were startled to be proven at least partly -- and maybe entirely -- wrong.
Our assumption was probably true until recently. B.C.'s share of the northern boreal forest, considered in isolation, continues to soak up enormous quantities of CO2. But the broad swath of light gray that appears along the B.C. coast in the map, indicating ambiguity and uncertainty in the data, is a startling reminder that our historic forest carbon "sink" may be switching to a net emitter of greenhouse gases -- a testament to wide-ranging changes in everything from forest decay rates to insect plagues unleashed by warmer winters.
That potentially consequential switch from net carbon sink to net carbon source underscored our frustration as we sought reliable, current and spatially detailed information about carbon emissions and sequestration in our forests. While we had some success digging up hard data on traffic, municipalities, and even exotic "blue carbon" near-shore habitat types, where carbon was moving in the woods proved far more difficult to track.
Provincial agencies, while generally helpful in responding to our requests, tightened up considerably when we asked for data on forest carbon flux. When we requested B.C.-specific data broken out of larger continental "ecozones," the request was denied on the grounds that disclosing B.C.'s forest carbon balance might, by subtraction, also reveal, "confidential emissions levels for other provinces and/or territories".
We opted to use the best data we could find from other sources that at least divided B.C. forests into a few giant ecozones. These obscure what must be significant differences in carbon uptake from valley to valley or region to region, depending on tree species, age, forestry activity, local micro-climate, forest fires or insect outbreaks, but it was the best information available.
Crude, tentative, and possibly tipping
Our picture of forest carbon flux is therefore admittedly both crude and tentative. The most prominent feature we visualize here is a swath of green carbon sink extending down through the B.C. interior from north to south. It gives the impression that B.C.'s interior forests are a vast and uniform zone of carbon sequestration. This is misleading. In reality our provincial forests are neither so homogenous nor even necessarily carbon sinks. On the critical second point, data from provincial and federal agencies point in conflicting directions: Canadian Forest Service data show B.C.'s forests still sucking carbon out of the atmosphere overall; provincial data show the opposite.
Not that Victoria's grasp of goings-on in Crown forests appeared especially robust in other respects. We learned that some 42 per cent of the province's forest has not been inventoried since 1990. An astonishing 30 per cent hasn't been inventoried in more than three decades since 1980. Given such fundamental uncertainty about how much forest, of what type, we have standing in B.C., estimating how much carbon it holds is, frankly, a crapshoot -- regardless of who crunches the numbers.
A more pleasant surprise was the seemingly supernatural carbon storage associated with so-called "blue" carbon environments -- like eelgrass beds and salt marshes in coastal B.C. marine waters. Anywhere from 50 to 70 per cent of all carbon stored by oceans is believed to be held in such "blue carbon" ecosystems. But despite their recognized importance, huge gaps still exist in what we know about their abundance in B.C., or the amount of carbon they hold.
Here, we relied on the pioneering efforts of the Sierra Club of B.C.'s Colin Campbell. Something of a voice in the marine wilderness, Campbell estimates that our coastal blue carbon stocks annually sequester carbon equivalent to the year's emissions from 200,000 cars. (Campbell and a coalition of grassroots volunteers champion improved mapping and protection for these critical blue carbon sinks.)
The biggest unavoidable omission from our map deserves a final note: it's the rest of the world. British Columbia has a vast and relatively pristine land base that is mostly uninhabited. Taking a close look at where we're sequestering or releasing carbon isn't to duck the reality that climate is a global event. Carbon sinks, including those located here, benefit all. Likewise our emissions, and those of others abroad, work to our common detriment.
Perhaps the most important thing we learned along the way is how much further we still have to go, if we're ever going to be able to see clearly, and in time, how our social, business, public and collective choices all reflect our personal responsibility for global climate change. ![]()
Read more: Labour + Industry, Environment


Tyee Commenting Guidelines
Comments that violate guidelines risk being deleted, and violations may result in a temporary or permanent user ban. Maintain the spirit of good conversation to stay in the discussion.
*Please note The Tyee is not a forum for spreading misinformation about COVID-19, denying its existence or minimizing its risk to public health.
Do:
Do not: