


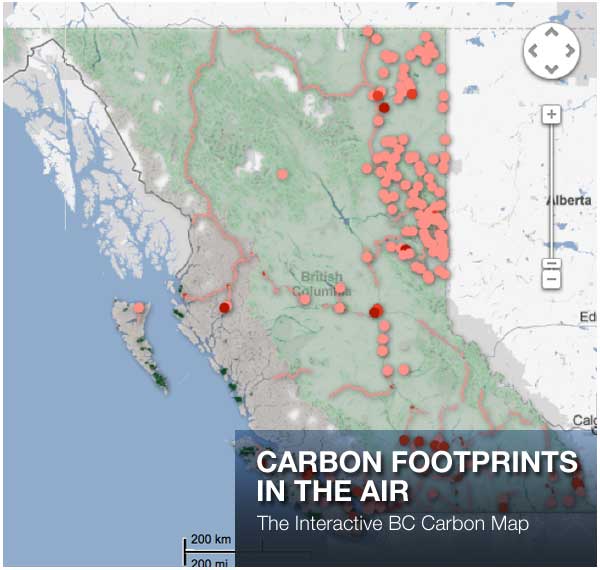
[Editor's note: Today The Tyee is proud to publish a Tyee Solutions Society map of British Columbia that, possibly for the first time, shows our collective carbon footprint. The map is interactive, which means you can turn sources and sinks on and off. We invite you to use the options to imagine how different choices can lead to different outcomes. For an in-depth discussion of the data sources, see this companion story. Tomorrow: Lessons Learned.]
What do we contribute to climate change, right here in British Columbia?
The answer is not as simple as the estimate of 62 million tonnes a year of carbon dioxide equivalent (CO2e) in emissions that provincial authorities currently cite. After all, greenhouse gasses escape in different amounts from many different activities. And some features of B.C.'s natural landscape pull important quantities of carbon back out of the air and "sink" it safely in organic plant matter, offsetting some of what humans release.
We thought it might help if we could actually see exactly where we're letting greenhouse gasses out into the atmosphere: what specific facilities or activities in our province have the heaviest climate footprint. We also thought it would be useful to be able to see where those carbon "sinks" are located too.
That's what this map does.
It's a way to see at a glance, across the whole province or down to your own municipality, what activities, where, are having the greatest impact on our changing climate as "sources" or "sinks" of atmospheric carbon.
We think it's kind of fun to explore; but then, we built it. We hope everyone else with an interest in our climate will at least find it helpful to visualize how specific choices affecting everything from shoreline development to traffic management might influence B.C.'s emissions.
The map is interactive. Zoom in to check out your community, or out for a provincial view. The buttons activate or remove from the map some of our most significant sink and source activities. (Note that however you set the buttons or scale, the indicated carbon balance reflects the area in the window and current button settings). Click on red dots or pinkish road lines to identify individual industrial facilities or highway sections, and the emissions they're responsible for. Clicking on elements in the table will show where we got those figures.
Visualizing our provincial carbon footprint this way revealed several stories to us. We hope you'll discover more. But here are a few things we've noticed already:
- Check out the blaze of pink across the Peace region in the province's northeast: that's the footprint of our expanding natural gas industry;
- Or follow the B.C. coastline, where dark green patches reveal the astonishing capture of carbon in salt marshes and eelgrass beds;
- Congested traffic crawl lights up our driving emissions: check out the most congested Lower Mainland commuter routes.
Our most startling finding, however, may be a direct -- if temporary -- challenge to the assertion that B.C. is responsible for releasing 62 mega-tonnes of climate-changing gasses a year. Our calculations reached a quite different bottom line: a negative overall carbon footprint, meaning that we're actually locking away more carbon in natural "sinks" than our human activities produce.
Huh? How can that be, you might ask, when we're pumping out millions of tonnes of excess greenhouse gas every year?
The explanation points to a critical wild card in British Columbia's carbon budget: a single factor that may determine whether our climate bottom-line is cooling "green" or hot "red" in the decade ahead.
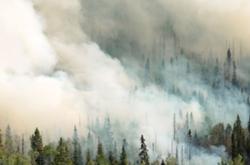
That factor is our forests. You can read elsewhere in detail about how we arrived at the figures we used. But in essence, experts are divided.
Growing forests capture carbon as a building block of plant life; dead or burning forests release CO2 and its climate-changing equivalents. Provincial officials -- echoed by many environmentalists -- assert that the balance shifted over the last decade from absorbing to releasing carbon. They claim that pine-beetle-killed dead wood and forest fires are now releasing more carbon from B.C.'s interior than living trees absorb. Those officials declined, however, to make available the detailed data that would confirm that.
Federal scientists did provide us with data, derived from observations over an 18-year period ending in 2008. It indicated that, as recently as then, four of the five "ecozones" in British Columbia were absorbing greenhouse gasses faster than they were being released by natural decay or fires. These ecozones were net carbon sinks. The carbon they absorbed more than offset the impact of a fifth ecozone -- the Pacific Maritime ecozone (which stretches the length of the B.C. coastline) -- which was a net carbon source.
It's true that our communities and industry emit vast amounts of carbon and absorb little to none: that's why they all appear in the visualization as "hot" pink-to-red. So it's all the more impressive that our living carbon assets -- forest and coastal marine vegetation -- have been pulling that much and more out of the atmosphere and sequestering it.
But our visualization of coastal B.C. -- the Pacific Maritime zone -- in grey, offers a dramatic reminder of how quickly that is changing. The Canadian Forest Service assesses that Pacific Maritime ecozone as being right on the cusp between sink and source -- an ambiguous status that reflects as grey in our colour scale. Put another way: when new data does become available, it may well confirm the gloomier provincial view.
What's certain already from the difference of opinions is that British Columbia forests are on a knife-edge tipping point between acting as one of our biggest climate assets, and turning into a diffuse and potent climate threat. We hope our interactive representation will underscore the potential significance of that switch.
To our knowledge, this is the first time anyone has brought together the necessary information to reveal our provincial climate footprint in such visual detail. Or made it available for British Columbians in a way that begins to let us try out a few simple "what if" choices ("what if" we lost those precious beds of eelgrass, for example?).
But like anything new, this one met a few unexpected surprises. One of those was the shocking discovery of how much nobody seems to know about some aspects of our climate footprint. We'll report more about that tomorrow.
Meanwhile, this is the first iteration of an experiment. Try it out. Pass it on. If you like it, find it useful, or see ways that we can improve it, please let us know in the comments below or send an email here.
For an in-depth discussion of the map's data sources, see this companion story. Tomorrow: Lessons Learned. ![]()
Read more: Environment


Tyee Commenting Guidelines
Comments that violate guidelines risk being deleted, and violations may result in a temporary or permanent user ban. Maintain the spirit of good conversation to stay in the discussion.
*Please note The Tyee is not a forum for spreading misinformation about COVID-19, denying its existence or minimizing its risk to public health.
Do:
Do not: