According to some knowledgeable observers, Vancouver's "crisis" in affordable housing is setting off a "gold rush" in innovative thinking, as people fed up with waiting for government action create their own new options on scales large and small.
That creative thinking, it turns out, isn't limited to finding alternative paths to affordable home ownership. With several British Columbia cities ranked among Canada's most severely unaffordable places to rent as well as buy, what's a squeezed tenant to do?
Enter the Rental Housing Index, launched today by the B.C. Non-Profit Housing Association as the umbrella group kicked off a conference for more than 800 delegates aptly subtitled, "From Crisis to Opportunity."
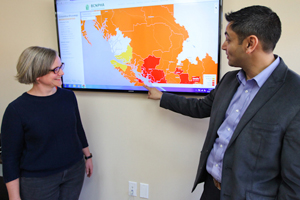
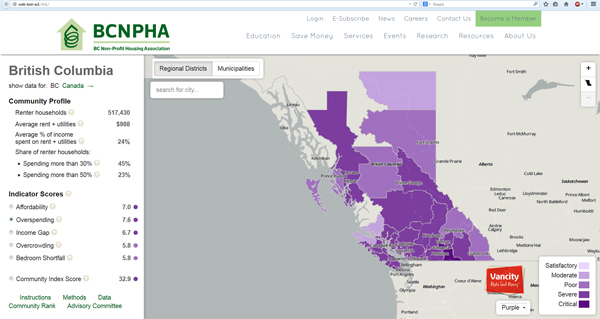
Displayed on a colourful and interactive map of the province, zoomable to any city or regional district, the 'index' gives planners, developers and non-profit organizations -- soon to include renters -- easily grasped visual information on who rents where, what's affordable where for every income level, and even how overcrowded people's homes have become.
Behind the map lies a staggeringly large dataset (if it were a single spreadsheet, there'd be 486 million cells), largely drawing from Statistics Canada's 2011 National Household Survey.
Similar information has long been available to private sector developers and the real estate industry engaged in selling condos. And B.C. is considered a leader for offering up thousands of other maps about its physical resources to the public through its GeoBC database.
But this is the first time demographic, geographic, income and housing costs have been mapped for rental households -- an estimated 55 per cent majority in Vancouver, for instance. And unlike that celebrated provincial initiative, this came fully from the non-profit sector, one more example of how civil society is stepping into the void left by the reduced role of various levels of government in providing housing.
"At the core of this, we really believe that what gets measured gets done," explained Tony Roy, the Non-Profit Housing Association's executive director. "So we took it upon ourselves to start to measure out what the rental situation looks like in British Columbia."
Widespread unaffordability
The index is the product of five variables based either on household income or the supply of lodgings deemed suitable for the number of tenants (see sidebar for details).
"It gives us a better sense of the costs that people are actually paying," says Jill Atkey, the association's research director who oversaw development of the index over the past year. One surprise, she adds, was how widespread average British Columbians' struggles to afford their homes were.
"I thought Vancouver would have all the problems, and as soon as you left Greater Vancouver everything would be hunky-dory. But it's not," she said. "Everyone has problems, to varying degrees. It was the absolute amount of working, desperately poor households we have in this province that astounded me."
And it's not only the poorest who struggle. A two-bedroom unit is only marginally affordable even for relatively better-off households, eating up nearly one-quarter of incomes in the two middle brackets -- from roughly $20,000 up to nearly $70,000.
The index also reveals that B.C. as a whole could use at least 85,000 more bedrooms to suitably house all the province's renters as measured by the Canada Mortgage and Housing Corporation's National Occupancy Standard.
How an index can help
How will the online index help get us there?
For now the tool is aimed at increasing the supply of housing. City planners, non-profits that provide social housing, even private sector rental developers, could all use the maps to help them decide where to build what sort of new rental housing to close that 85,000-unit gap, Atkey explained.

"As a tool, it'll be very useful for municipal and regional planners, particularly in areas outside the Lower Mainland where they just don't have the capacity to do custom data requests and analyze them," she said. "This will not tell them where and what to build, but it's a good enough, high level analysis that they can go into a community and do their own research."
Non-profits, always pinched for pennies, can determine more accurately where the need is greatest for social housing, and what prospective tenants in those places can afford to pay.
Private developers could also find the database useful to target places with a need and income support for new market units.
Down the road, Atkey hopes to add more detailed layers of data so renters themselves can plug in their incomes and location, and see what the affordable housing situation looks like for them. But that, interjected Roy, will be part of a "version 2.0" of the index that will be worked on over the coming year.
'End of an era for social housing'
Meanwhile, can we take the new tool as a sign that housing non-profits have abandoned their expectations of government, and instead are turning to the wisdom of the private sector, hoping to achieve a broader social purpose than just selling real estate?
"We're going to have to, to some degree," was his answer, "because we're at the end of an era for social housing."
That era's heyday was three decades ago, when the federal government was generous with subsidized mortgages and other assistance to low-income tenants. But that era is coming to an end.
Some advocates, fearing that the impending loss of funding will worsen the affordability crisis for thousands of tenants, continue to demand federal, provincial and municipal governments step in.
Roy represents another view: non-profits that already operate thousands of units of affordable housing, now have a chance to shine.
"The end of that era does create lots of opportunities," he said. "There are some areas where the opportunities [are] right in front of us."
With his association's new tool, they're now a lot more visible. ![]()


Tyee Commenting Guidelines
Comments that violate guidelines risk being deleted, and violations may result in a temporary or permanent user ban. Maintain the spirit of good conversation to stay in the discussion.
*Please note The Tyee is not a forum for spreading misinformation about COVID-19, denying its existence or minimizing its risk to public health.
Do:
Do not: