


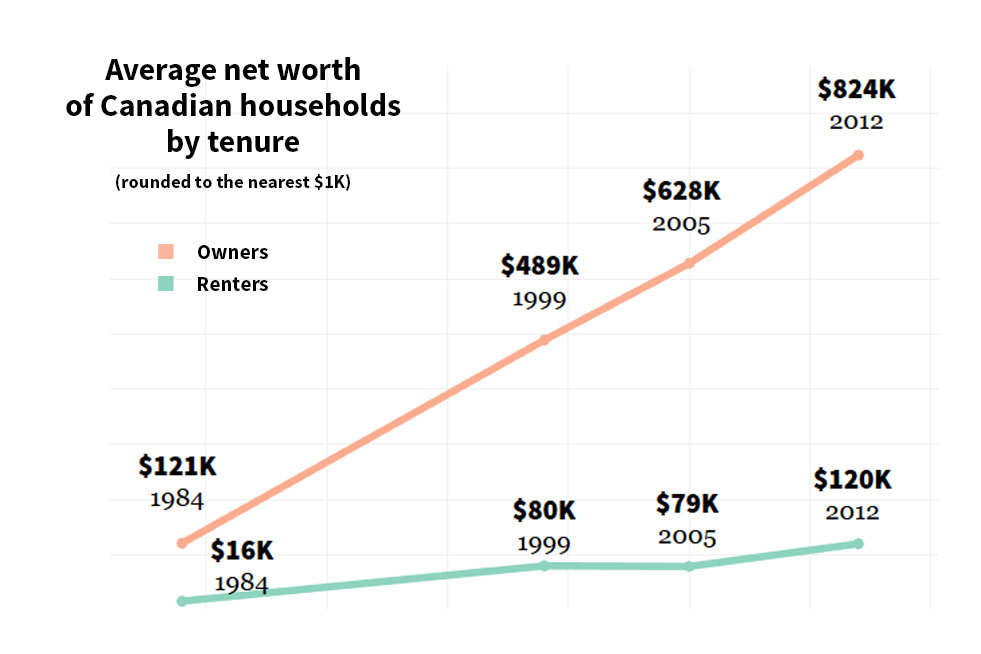
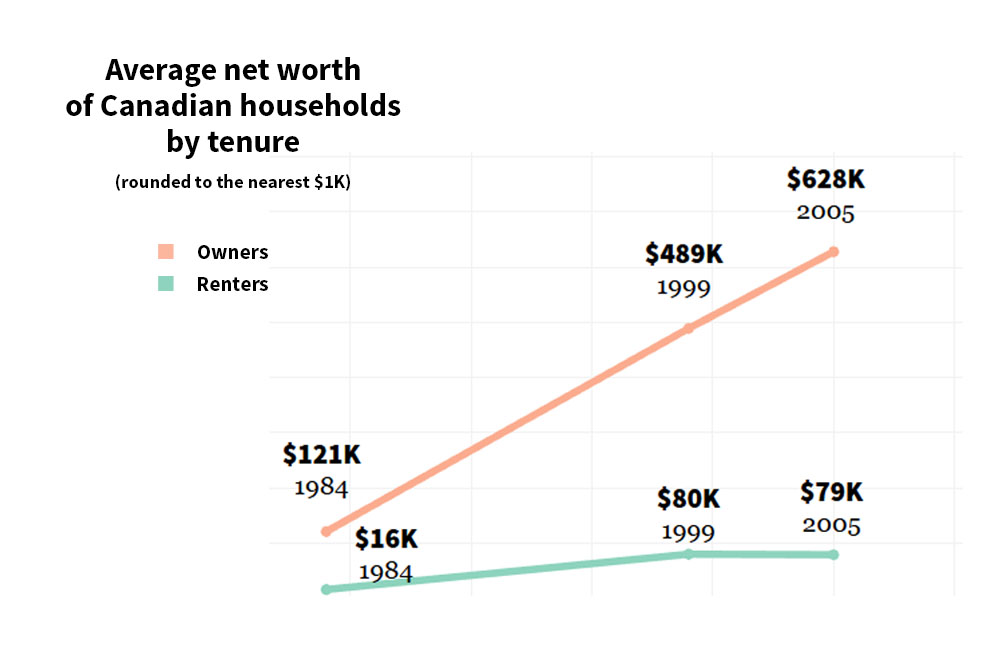
In 1984, the average Canadian who owned a home was about $104,000 richer than the average renter.
By 2012, the average Canadian homeowner was worth $824,000—the average renter just $120,000 (in constant dollars). That’s a seven-fold increase in wealth gap between owners and renters over 28 years. It’s doubtless even wider five years later. In Vancouver, roughly half of households are in each camp.
How did one half of Vancouver get so much richer than the other?
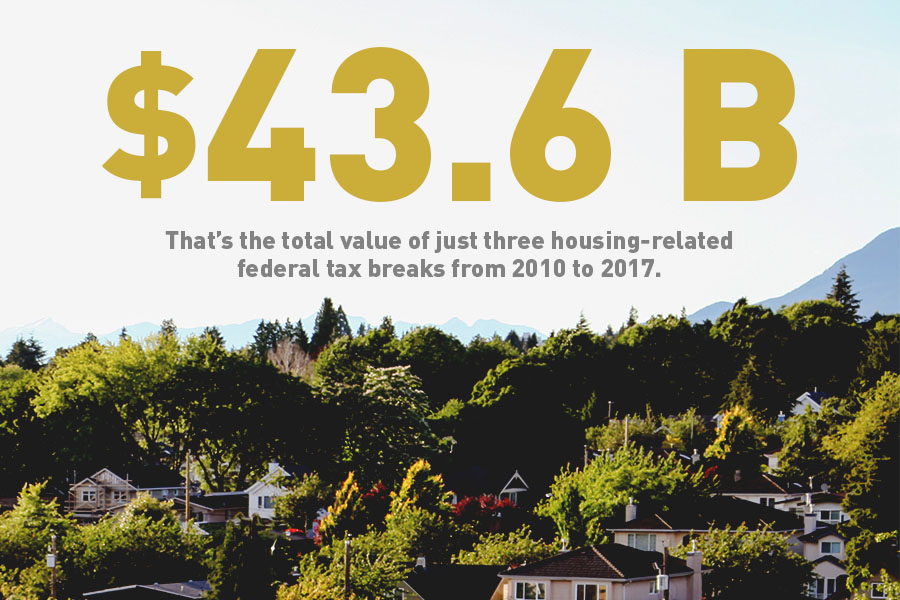
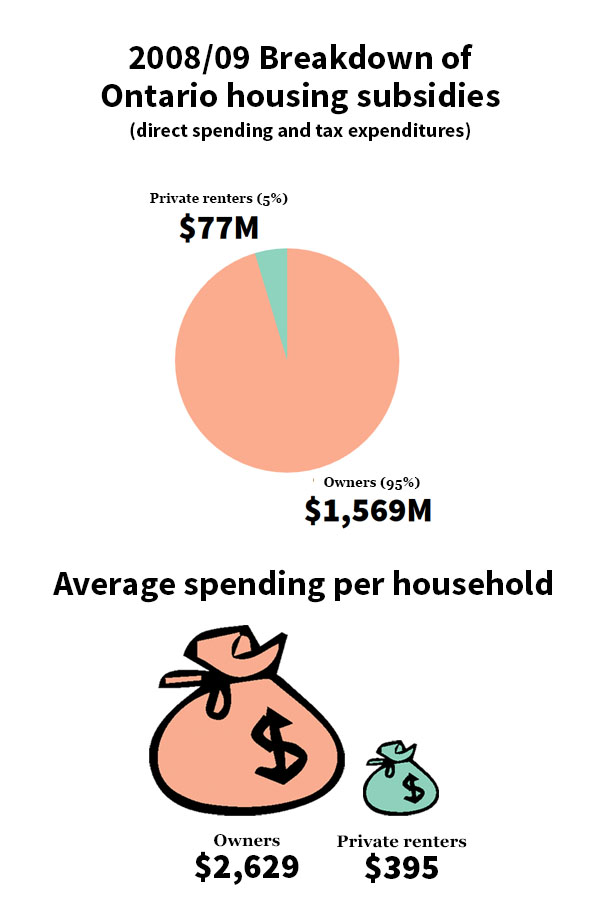
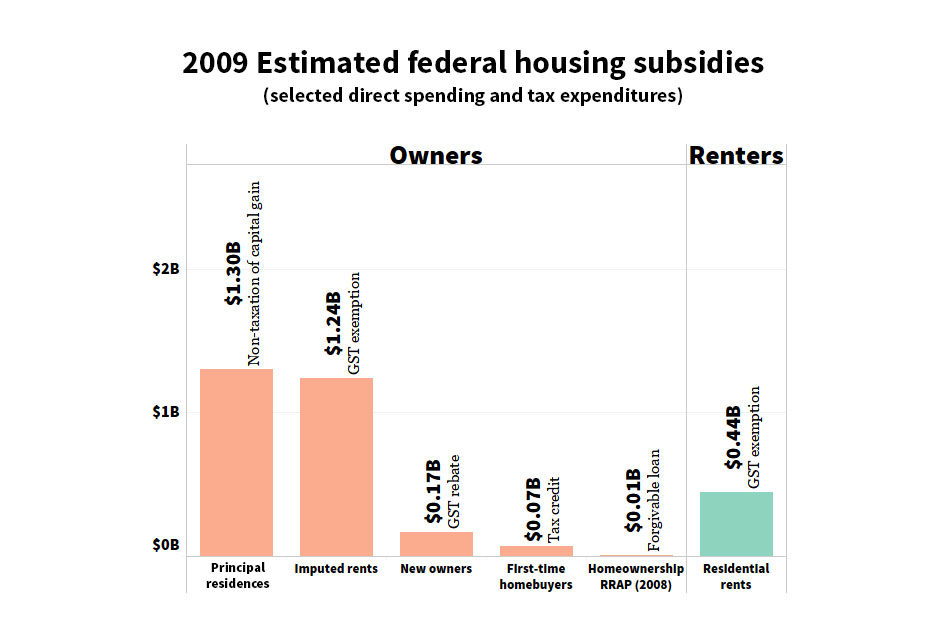
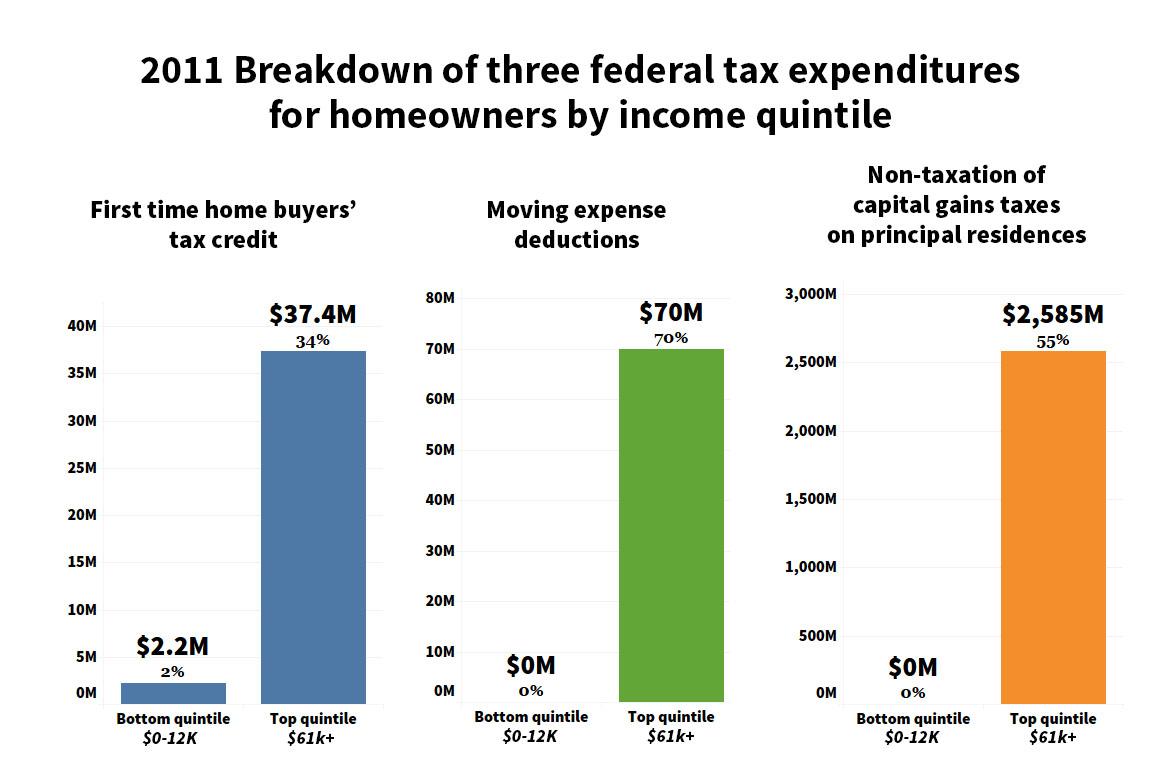
While it’s clearly not the only factor, decades of federal and provincial favouritism in tax spending have in effect pumped billions of dollars into the accounts of Canadians who own their homes, while dribbling a comparative pittance into the pockets of renters. And some of the biggest perks have gone to the very richest of Canadians. Nearly 90 per cent of the $43.6 billion in benefits lavished exclusively on home owners in this decade alone were accounted for by the exemption from capital gains tax for profits earned on the sale of a principal residence.
These graphs follow how federal tax favours have helped make Canadian home owners an awful lot richer, while renters’ savings have inched up. A future article will look at how we might restore a fairer balance.
Sources:
#1. Government of Canada, Ministry of Finance. 2010-2017 Report on Federal Tax Expenditures - Concepts, Estimates and Evaluations.
#2, #6, #9. CMHC. “Home Equity and Net Worth by Tenure and Age Group, Canada 1999, 2005 and 2012 (2012 constant dollars)”; 1984 numbers, CMHC, “Concentration of Wealth Through Ownership”.
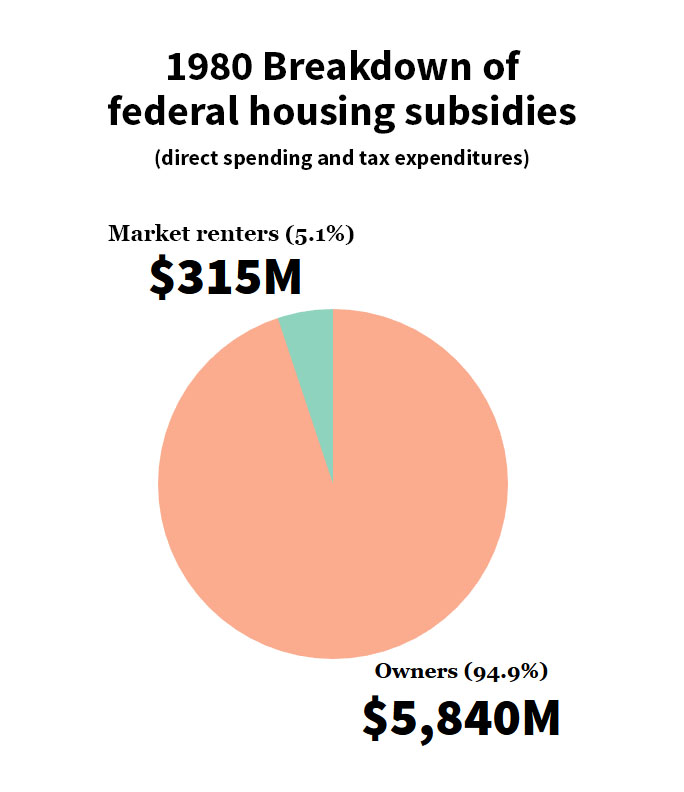
#3. Dowler, Robert G. Housing-related Tax Expenditures: An Overview and Evaluation. February 1983, Centre for Urban & Community Studies, University of Toronto.
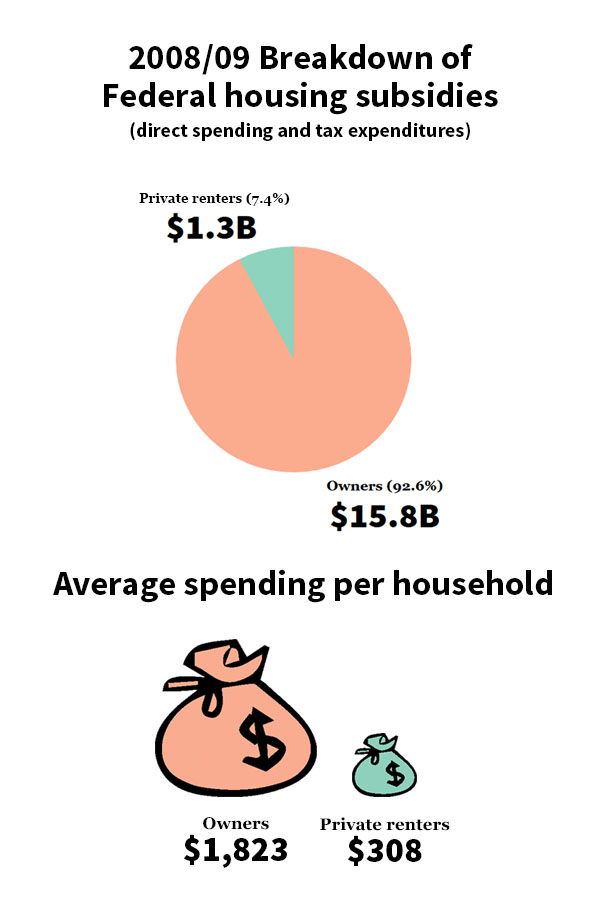
#4, #5, #7. Clayton, Frank. Government Subsidies to Homeowners Versus Renters in Ontario and Canada. August 30, 2010.
#8. Macdonald, David. Out of the Shadows, Shining a Light on Canada’s Unequal Distribution of Federal Tax Expenditures. The Canadian Centre for Policy Alternatives. December 5, 2016.
Many of the numbers in the statistics and reports above were rounded. In addition, the Tyee also rounded some numbers in the visualizations for clarity. ![]()
Read more: Housing


Tyee Commenting Guidelines
Comments that violate guidelines risk being deleted, and violations may result in a temporary or permanent user ban. Maintain the spirit of good conversation to stay in the discussion.
*Please note The Tyee is not a forum for spreading misinformation about COVID-19, denying its existence or minimizing its risk to public health.
Do:
Do not: