


Over the past century, Cascadia--the region encompassing British Columbia, Idaho, Oregon, Washington, and western Montana--has changed dramatically. Cascadians have multiplied their number ninefold, added three decades to their lives, and increased their economic output thirtyfold. Their cities and farms have spread across the region's most fertile lowlands. Their clearcuts, dams, ranches, and roads have transformed much of the remaining landscape.
These changes--you could call them "slow news"--are extreme over decades but almost imperceptible day to day. Yet they shape the region's future more profoundly than fleeting, headline-grabbing events. But such long-term trends are poorly tracked. To fill this gap Northwest Environment Watch (NEW) has spent months researching the Cascadia Scorecard (PDF link), a new regional gauge of progress that monitors and compares seven trends (PDF link) critical to the region's future: health, economy, population, sprawl, energy, forests, and pollution.
Today we unveil our results for British Columbia. The province boasts the second longest lifespan in the world and is a regional model for smart growth, but lags significantly in economic security for its residents. Some specifics:
Health
- Lifespans are relatively long throughout the Northwest--averaging 80.7 years in BC and 78.9 in the Northwest as a whole. BC boasts the Pacific Northwest's longest lifespan, and if BC were an independent nation, it would have the second longest life expectancy in the world, trailing only Japan.
- In BC, 15-to-24 year olds are only half as likely to perish in an accident as their Washington counterparts. Suicides are nearly three times more common in Washington than in BC; dying of homicide, about four times more likely. Later in life, British Columbians are far less prone to die of heart disease and slightly less likely to fall victim to cancer than other northwesterners.
Economy
- British Columbia has seen rising poverty from 1990 to 2002 (14.7 to 17 percent) while Canada's poverty rate fell to 14.4 in 2002. Since 1999 the province's poverty rates have exceeded the national average.
- For most of the 1990s, B.C. enjoyed lower-than-national jobless rates. But beginning in 1998, B.C. unemployment exceeded the Canadian rate, and by 2002, the unemployment rate--at 7.9 percent--was higher than that of any American state.
- British Columbia also lost its lead in median income: While Canada's inflation-adjusted median income registered no net growth from 1990 to 2001, British Columbia's shrank by more than 4 percent. In 2001, B.C.'s median income was Can$38,600, about Can$1,000 lower than in Canada.
Population
- The province's birthrate declined to a record low of 9.7 in 2002--below the Canadian level of 11 and in the range of such stable-population countries as Germany, Italy, and Japan. The rest of the Pacific Northwest lags behind B.C., but still claims birthrates below the U.S. average.
- Teen birthrates in British Columbia are the lowest in the region by far, at 13 births per 1,000 teenage women in 2002, compared to Washington at 33--almost three times the BC rate.
- British Columbia has far fewer accidental pregnancies than the Northwest states, and women in BC tend to delay childbirth--births to women in their 30s are likely soon to exceed births to women in their 20s, and births to women in their 40s may soon overtake births to teens.
Energy
- British Columbia's per capita gasoline use has recently increased to 20.9 liters a week in 2002; Germans and Britons use less than half as much gasoline per person. But residents of the Northwest states still use fully 57 percent more gasoline per person than British Columbians, in part due to a larger road network. Per resident, Washington has a quarter more miles of streets and highways than BC, Oregon has two-thirds more, and Idaho has three times more.
- The province's more limited use of automobiles saves British Columbians a bundle; they put less than half as much money per capita into roadwork as their counterparts in the Northwest states and, despite 10 percent higher gasoline prices, their annual fuel bills are at least 25 percent lower.
- B.C.'s non-industrial electricity use has also climbed since 1990, but residents are still consuming less electricity than residents of the Northwest states and also less than Canadians and Americans overall.
Sprawl
- Greater Victoria, with one in three residents living in compact neighbourhoods, has controlled sprawl better than any other Northwest metropolis except Vancouver. Victoria has roughly the same population as Boise, Idaho, but five times as many residents living at densities greater than 12 people per acre. Still, its success is limited: over the past decade, it has gained slightly more residents at sprawling densities than in compact neighbourhoods. Click here to see how population density has increased over time in the Victoria area.
- In 2001, more than six in ten residents of greater Vancouver lived in compact neighborhoods, almost twice as large a share as in any other Northwest metropolis. However, Vancouver's overall urban density still ranks below that of eastern Canadian cities such as Montreal and Toronto, and it has done a poor job of creating new jobs near housing centers. Click here to see how population density has increased over time in the Vancouver area.
Forests
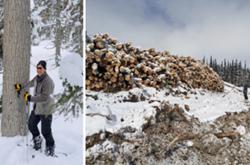
- The Scorecard uses NASA satellite images to study clearcutting over the last 30 years in five study areas in the Northwest, including two contiguous areas in the BC interior. Although one-tenth of the forests in the two study areas combined are protected from logging, more than 2.5 million acres (1 million hectares) have been clearcut since 1976, almost one-fifth of the original total, mostly in areas managed by the provincial government. Logging in B.C. is almost exclusively in virgin forest, which is richer in native biodiversity.
- Cutting in the two B.C. study areas was most rapid in the 1970s and 1980s. The rate of cutting slowed during the 1990s but appears to have surged again since 2000. The BC interior also contains what is reputedly the world's largest clearcut, the Bowron Cut.
- To view an animated map of clearcutting over time in B.C.'s inland rainforest click here, and for clearcutting over time in the Williams Lake region, click here.
Pollution
- The Cascadia Scorecard monitors concentrations of toxic substances in the bodies of northwesterners, measured through sampling of breast milk among new mothers. Full results for this indicator will be released later this year, but initial results for the Puget Sound area are worrisome. Mothers there had high levels of certain flame retardants in their breast milk, levels 20 to 40 times as high as is prevalent in Japan and Europe.
Tracking the big picture
For B.C. and its region, what's the big picture? To see how B.C. compares with other members of Cascadia, as measured by our seven indicators, click here (PDF link).
Overall, four of the indicators offer good news. Cascadia shines in human health--the region's lifespan ranks eighth in the world. Its economic security and birthrates are also good, by world standards. Clearcutting has decelerated, though it remains rapid.
But there are many areas for improvement. The two biggest priorities are controlling sprawl and energy consumption: despite a well-deserved reputation for innovation in energy efficiency, northwesterners still consume almost like Texans. And though they are building communities that are more compact, sprawl is still the region's dominant pattern of growth. Unintended pregnancies and births to teens remain commonplace. And northwesterners' economic security did not keep pace with North America overall.
The Scorecard presents an experimental, three-step method for combining the indicators into a unified index that marks how far away the region is from reaching a real-world goal for each indicator. Japan, for example, is the target for lifespan. Vancouver, B.C.'ers are a best-in-the-region model for sprawl. Germany suggests a goal for energy use.
Thousands of people in this region are already at work on a future in which Cascadia leads the world, in which the Pacific Northwest achieves the elusive goal of reconciling people with place. Our newly published book Cascadia Scorecard points to several priorities. To yield dramatic improvements in energy and sprawl will require approaches that are systemic, such as tax shifting; redirecting markets to promote sustainability; and--as a foundation--better monitoring of the region's progress through projects like The Scorecard.
What we watch, we change. Attending mostly to the dramatic, we neglect the slow. Monitoring flawed gauges such as stock prices, consumer confidence, and gross domestic product, we organize our institutions to generate high stock prices, confident consumers, and an increasing GDP. Conversely, because we do not watch them, we do not get the healthiest lives, the strongest communities, or the most vibrant ecosystems. The ultimate aspiration of The Cascadia Scorecard is to give us these things.
Alan Durning is Director of Northwest Environment Watch, a Seattle-based nonprofit research and communication center. The Cascadia Scorecard will be updated regularly both in publications and at www.cascadiascorecard.org ![]()


Tyee Commenting Guidelines
Comments that violate guidelines risk being deleted, and violations may result in a temporary or permanent user ban. Maintain the spirit of good conversation to stay in the discussion.
*Please note The Tyee is not a forum for spreading misinformation about COVID-19, denying its existence or minimizing its risk to public health.
Do:
Do not: