In Vancouver this decade, I’ve seen houses bought up on Cambie Street like Monopoly properties to be redeveloped as castles of condos; immigrant businesses — like Vietnamese noodle shops and the Polish Café Zofia — on once-working class Fraser Street close, with local chefs opening hip new eateries in their place; and people of colour in scrubs and fast food uniforms settle into their seats on trains or buses for their long commute from car-dependent suburbs.
Others who live in Metro Vancouver might’ve glimpsed these scenes too, but what they don’t show is the bigger picture of how our region is changing — and becoming more segregated and unequal. It’s the side often ignored when heralds share the dense and sustainable “Vancouverism” school of city building with the world.
David Hulchanski of the University of Toronto is the principal investigator of the Neighbourhood Change Research Partnership. Last year, the team released maps updated with the latest census data to show how neighbourhoods in Canadian urban centres, including Metro Vancouver, have changed over the years, focusing on the shifts in low-, middle- and high-income neighbourhoods.
They consider middle-income neighbourhoods as census tracts where the average individual income is within 20 per cent of the region’s average. Low-income neighbourhoods are census tracts below that range, and high-income neighbourhoods are the census tracts above it. (Census tracts are small areas, typically with 2,500 to 8,000 residents.)
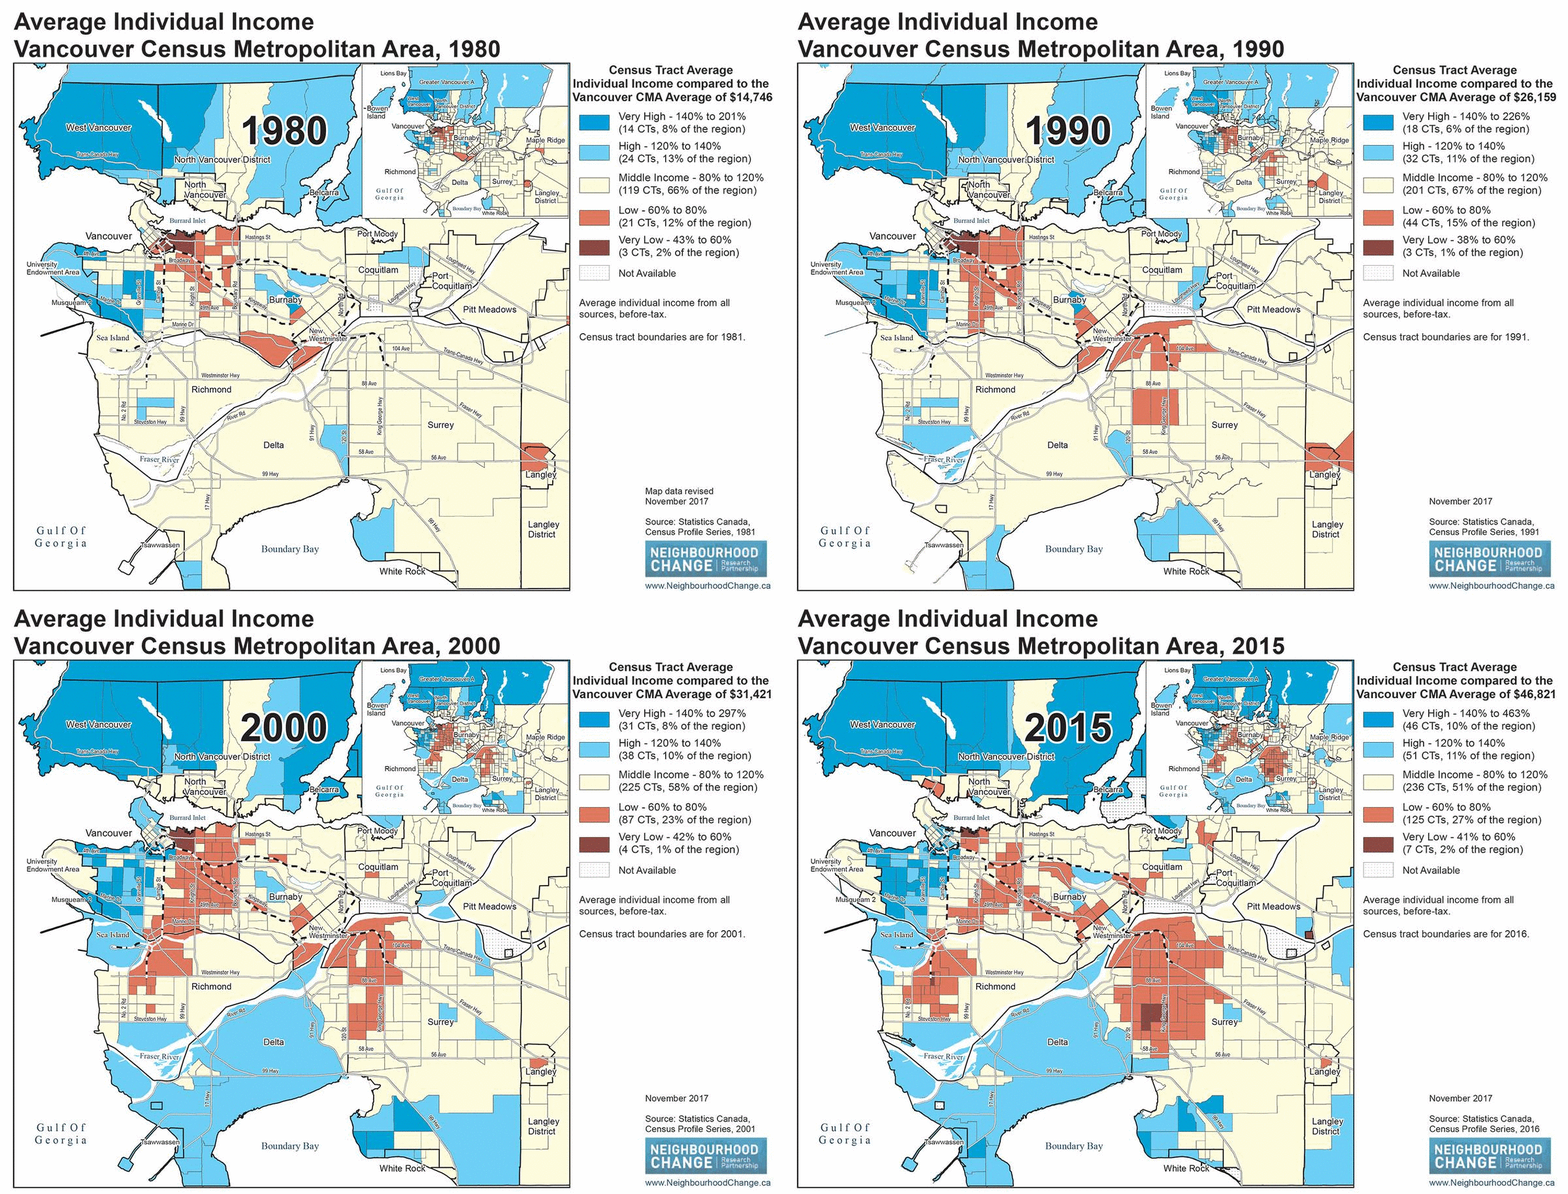
The maps tell the story of wealthy people moving into the central city as poorer people are pushed further out. Bedroom communities — such as Burnaby, Richmond and Surrey — which were once middle income are now home to the majority of people in the region with below-average incomes.
When Hulchanski began this research, a three word phrase dawned on him: “Money buys choice.” People with money have access to convenient, amenity-rich urban living; people with less money can only afford the farther flung areas unclaimed by the more affluent.
But I had a question about these low-, middle- and high-income neighbourhoods: who exactly are the people living in them? How do the people living in the lower income neighbourhoods differ from those in higher income areas — aside from having less money?
Hulchanski and the team recently produced charts looking at Toronto neighbourhoods in each income category using factors such as ethnocultural group and education.
Using their method, and with some pointers from the team’s data analyst, I did the same for Metro Vancouver.
Here’s what I found.
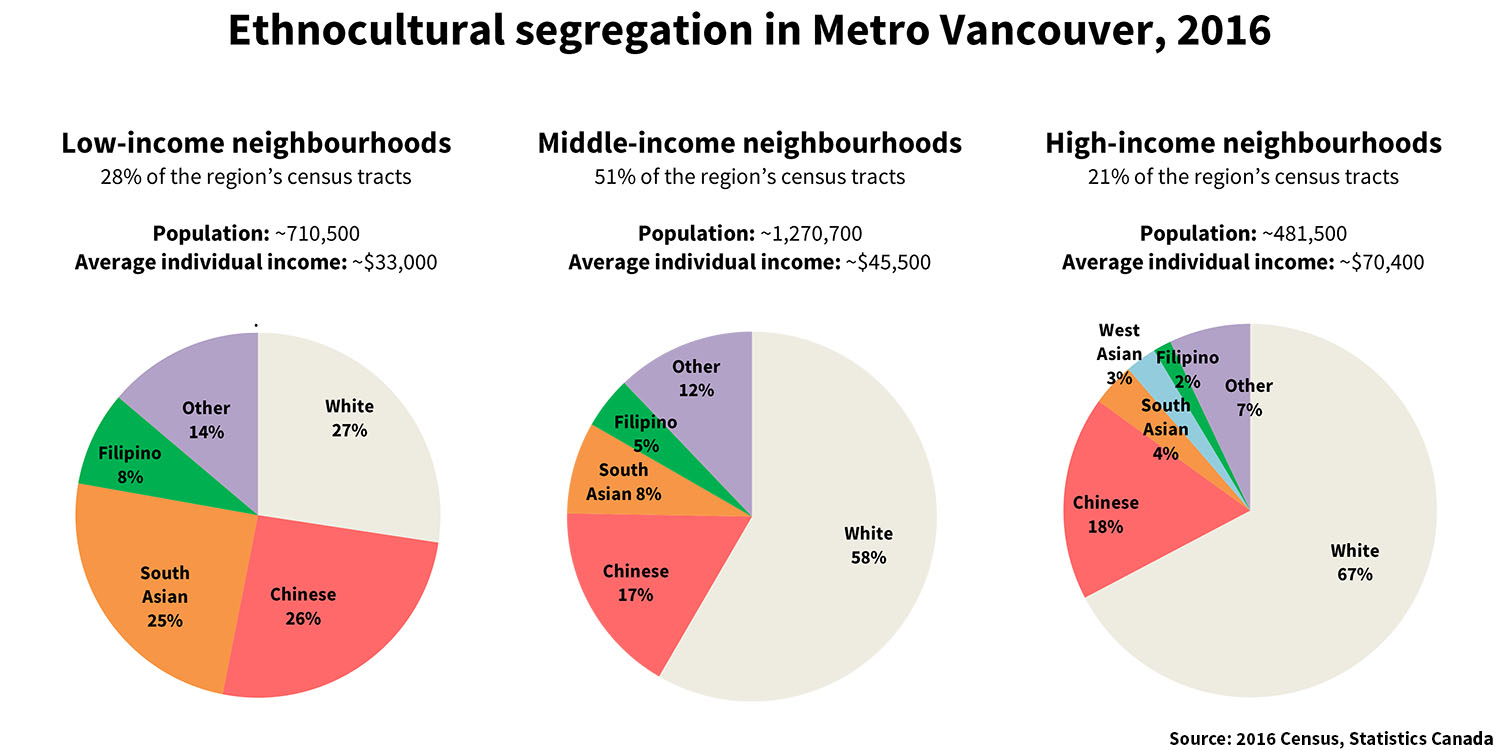
We like to think of Metro Vancouver as a multicultural place to live, but these charts show us that diversity is greatest in low-income neighbourhoods, and high-income neighbourhoods are the whitest.
Two-thirds of the population in high-income neighbourhoods is white.
But in low-income neighbourhoods, whites make up a little more than a quarter of the population. The other 73 per cent identify as minorities.
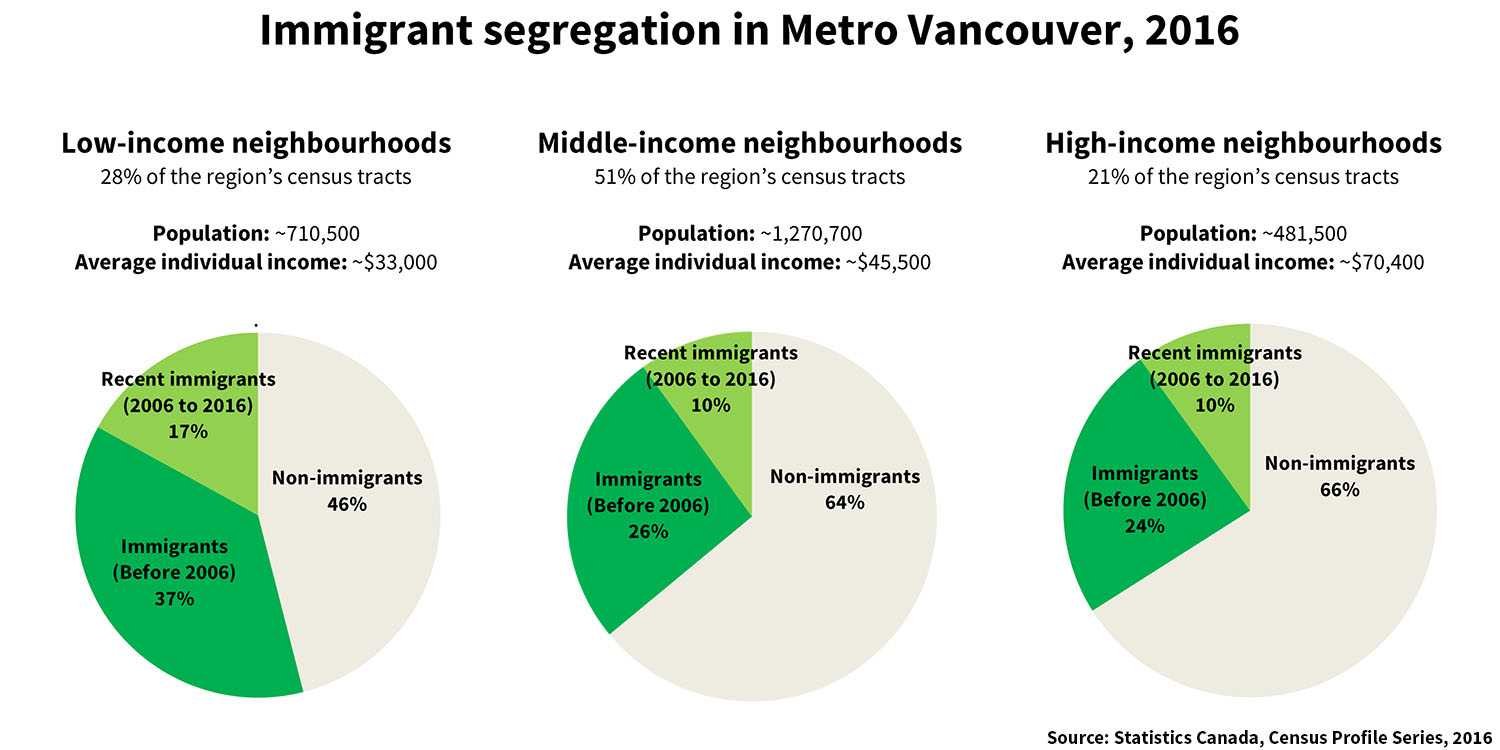
Immigrants make up a greater share of the population in low-income neighbourhoods than middle- and high-income ones. Low-income neighbourhoods are also home to more recent immigrants (measured here as settling between 2006 and 2016).
And considering that low-income neighbourhoods are mostly located in suburban municipalities, recent immigrants are settling farther away from Vancouver proper. Twenty-seven per cent of Vancouver’s immigrants came recently. In Burnaby and Richmond, 28 per cent of immigrants are recent. In Coquitlam, 30 per cent are recent, and in Surrey, 33 per cent are recent.
“Affordable housing is especially challenging for refugees with large families,” noted Queenie Choo, the CEO of social services non-profit SUCCESS.
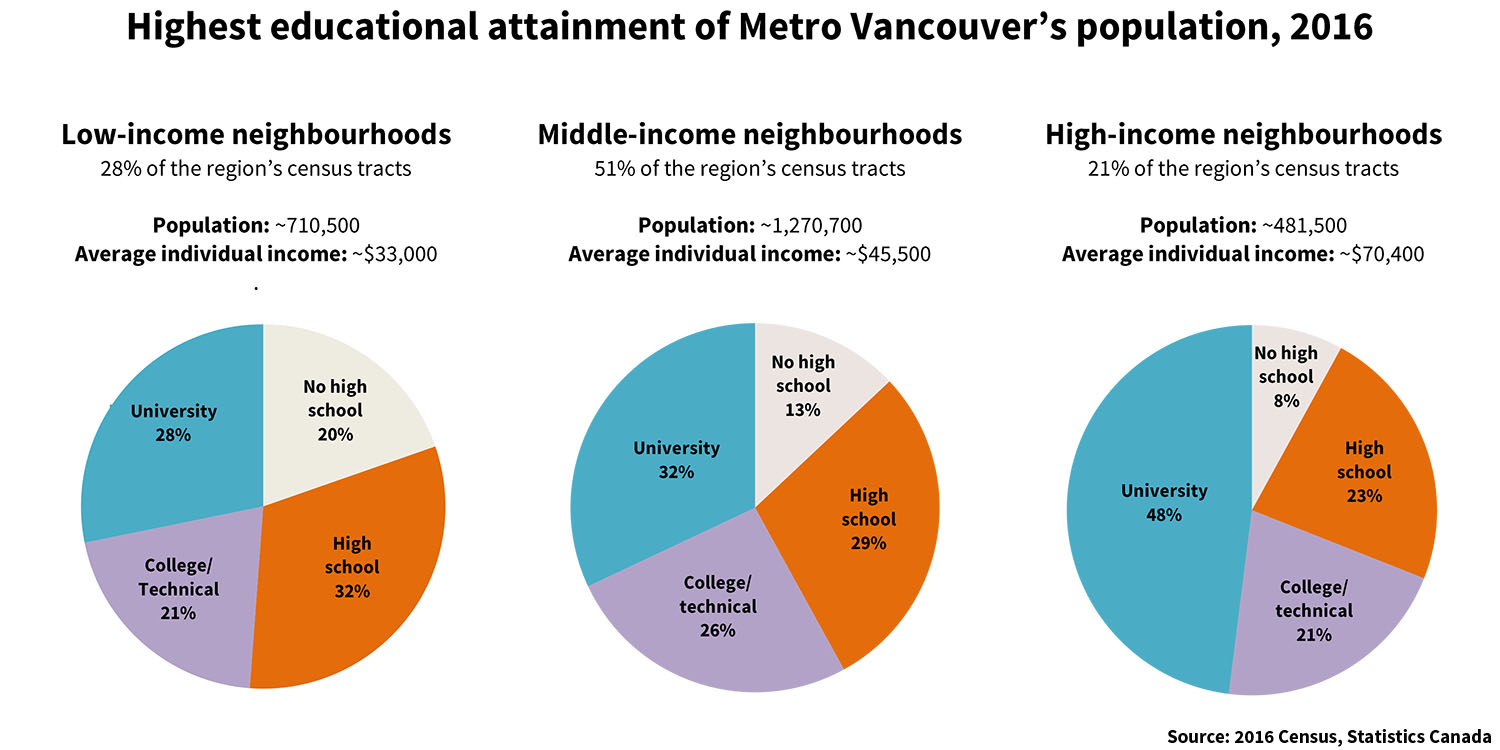
It might be surprising to learn that about half of the people who live in low-income neighbourhoods have post-secondary education. Hulchanski says this highlights discrimination.
“Some of the poor are highly educated,” he said. “We have all this talent, but there’s that term ‘You don’t have Canadian experience.’ It might be racism, it might be an accent, or that they ‘won’t fit in’ with the company.”
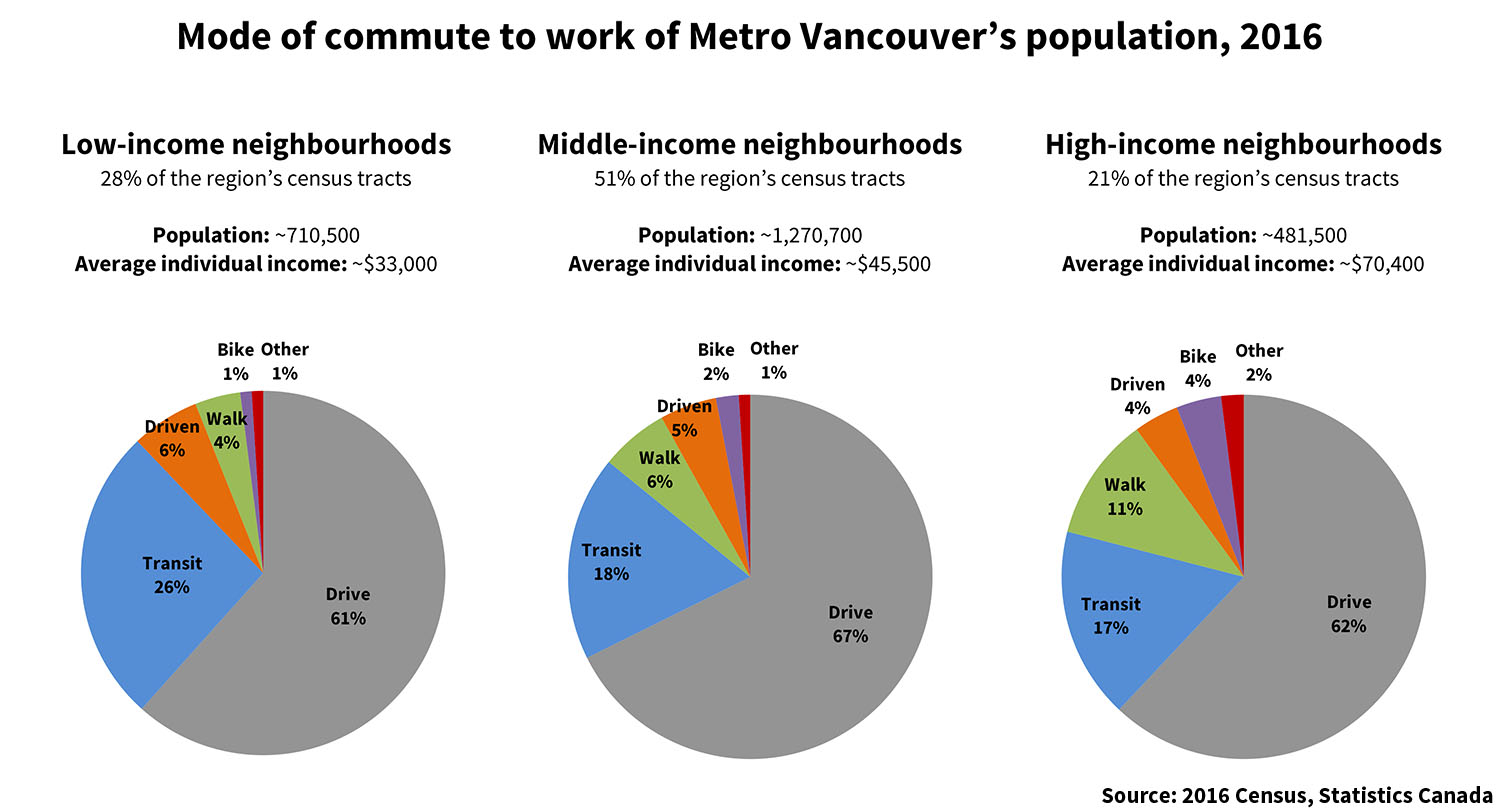
The car is still king for working Metro Vancouverites, no matter where they live. Driving is the most popular way for people to get to work by far.
There’s a bigger share of workers in low-income neighbourhoods who use transit than in high-income ones, 26 per cent versus 17 per cent.
However, there’s a bigger share of workers in high-income neighbourhoods who walk and bike, 11 per cent and four per cent respectively. The share of walkers in low-income neighbourhoods is four per cent and the share of bikers is one per cent. Because the majority of low-income neighbourhoods are car-oriented sprawl, this is likely due to design rather than preference.
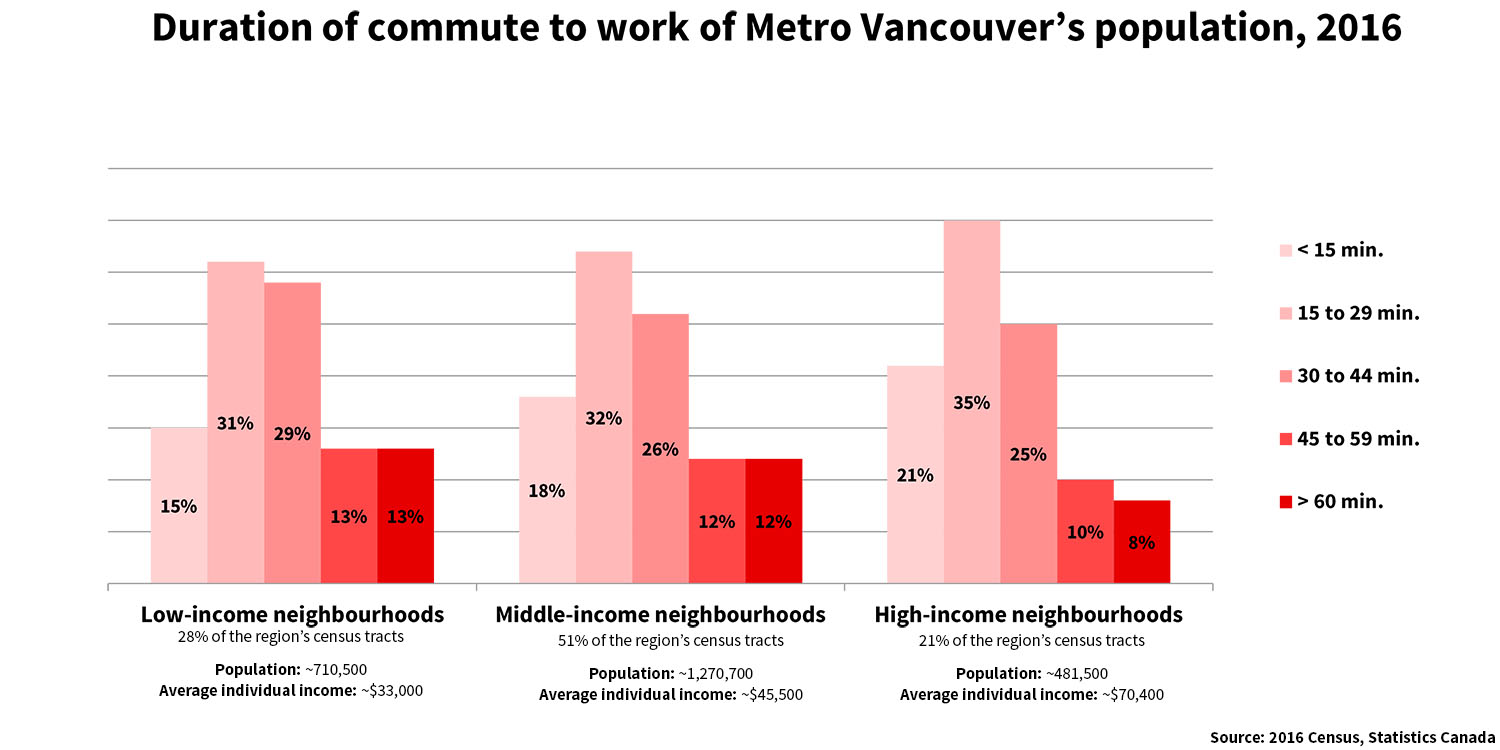
Workers in high-income neighbourhoods also have less time eaten up by their commutes.
Neelam Sahota, the chief executive officer of Surrey-based non-profit DIVERSEcity Community Resources Society, says the car-oriented city is a challenge for locals and newcomers.
As far back as 1956, the Lower Mainland Regional Planning Board called sprawl “socially inconvenient and economically stupid.” But middle-income families wanted the spacious “country living” suburbia provided.
We have a challenge now as low-income people have settled in those post-war suburbs. For low-income people, buying a vehicle, maintaining it and paying for gas are big expenses. For newcomers, there’s the additional challenge of navigating the local licensing system and getting used to the road layout, said Sahota.
But relying on public transit in a sprawling city like Surrey is also a struggle, and if workers are commuting to another city, they’ll have to pay more.
“This is why investing in transportation is a form of economic development,” said Andy Yan, the director of Simon Fraser University’s City Program.
Surrey’s layout is especially challenging for seniors.
“It’s quite a hefty distance just to get to a major road serviced by the bus,” said Sahota. “Seniors feel very housebound because of that… They tend to be in houses or basements far away from arterials. This really shows how important good urban planning is.”
One of DIVERSEcity’s programs has contractors and volunteers drive seniors on errands such as medical visits, bank appointments and grocery runs. Immigrant seniors with limited English or non-North American cultural backgrounds are matched with helpers from the same background. That cultural understanding is very important, says Sahota. For example, other cultures view family roles and expectations differently from North America.
A divided region
Neighbourhood Change’s data show an increasingly unequal Metro Vancouver.
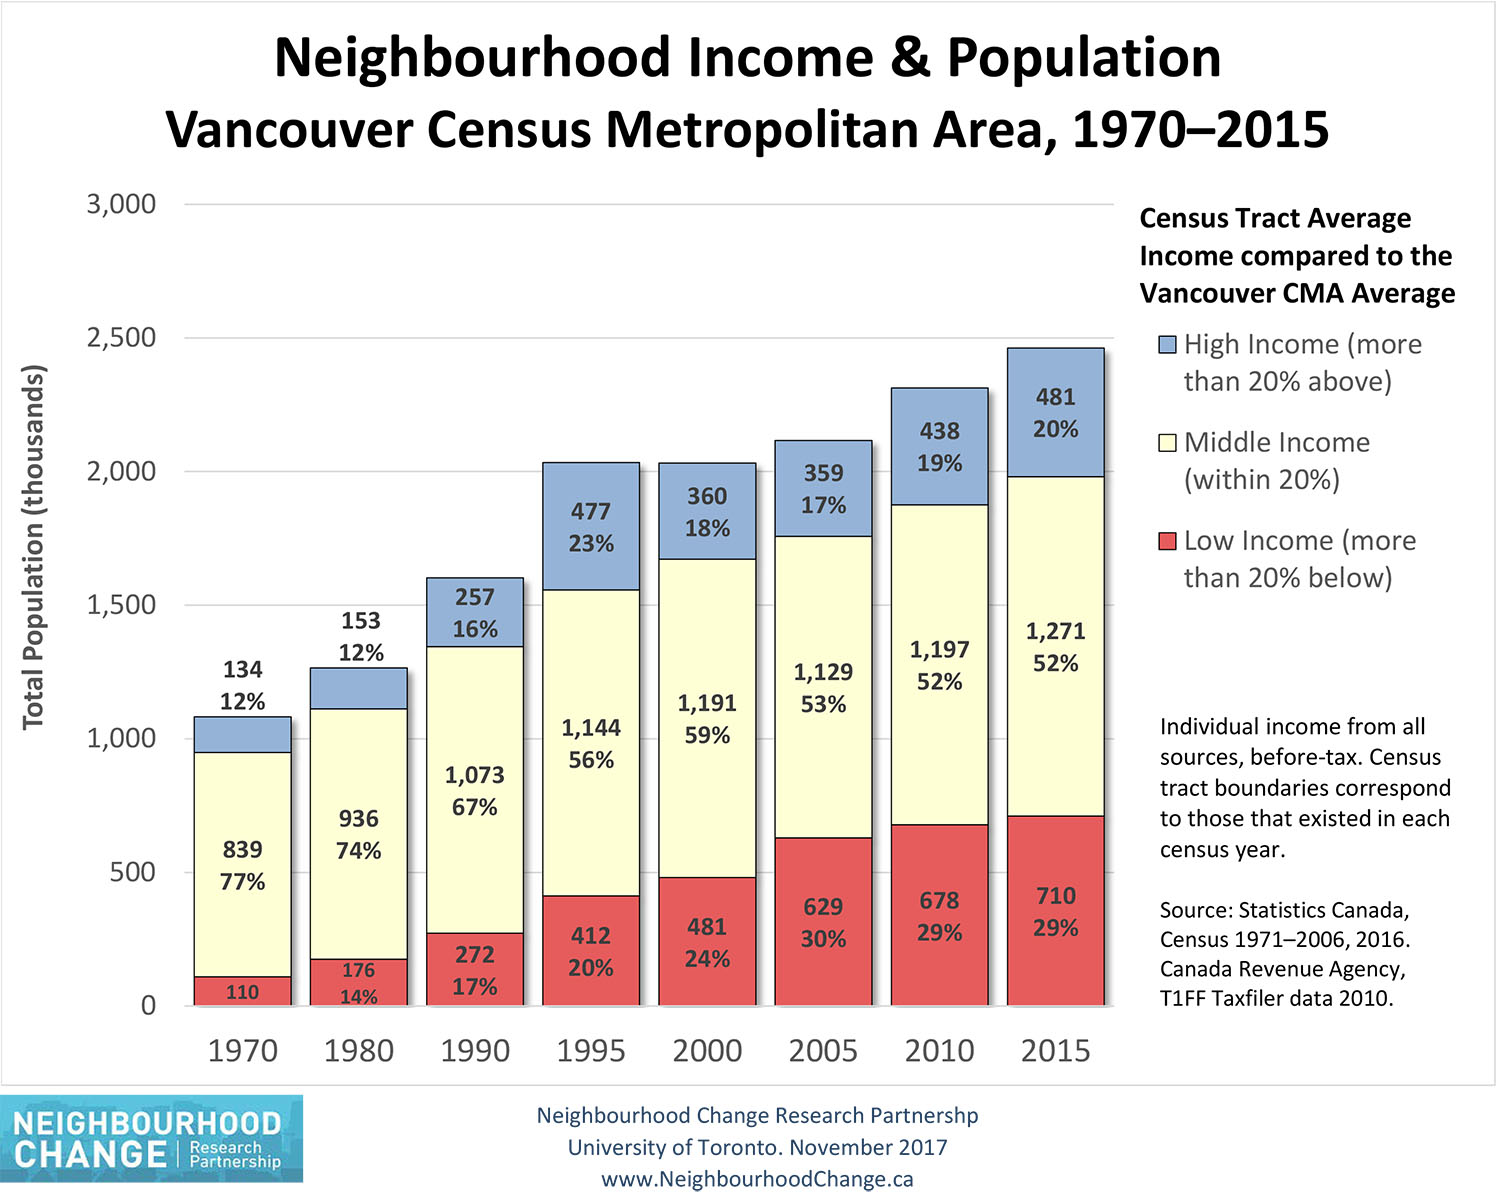
In 1970, 77 per cent of census tracts were middle income. By 2015, that had dropped to 52 per cent. The share of high-income census tracts increased from 12 to 20 per cent. More dramatically, the percentage of low-income tracts has almost tripled, from 10 to 29 per cent.
Metro Vancouver is becoming increasingly polarized.
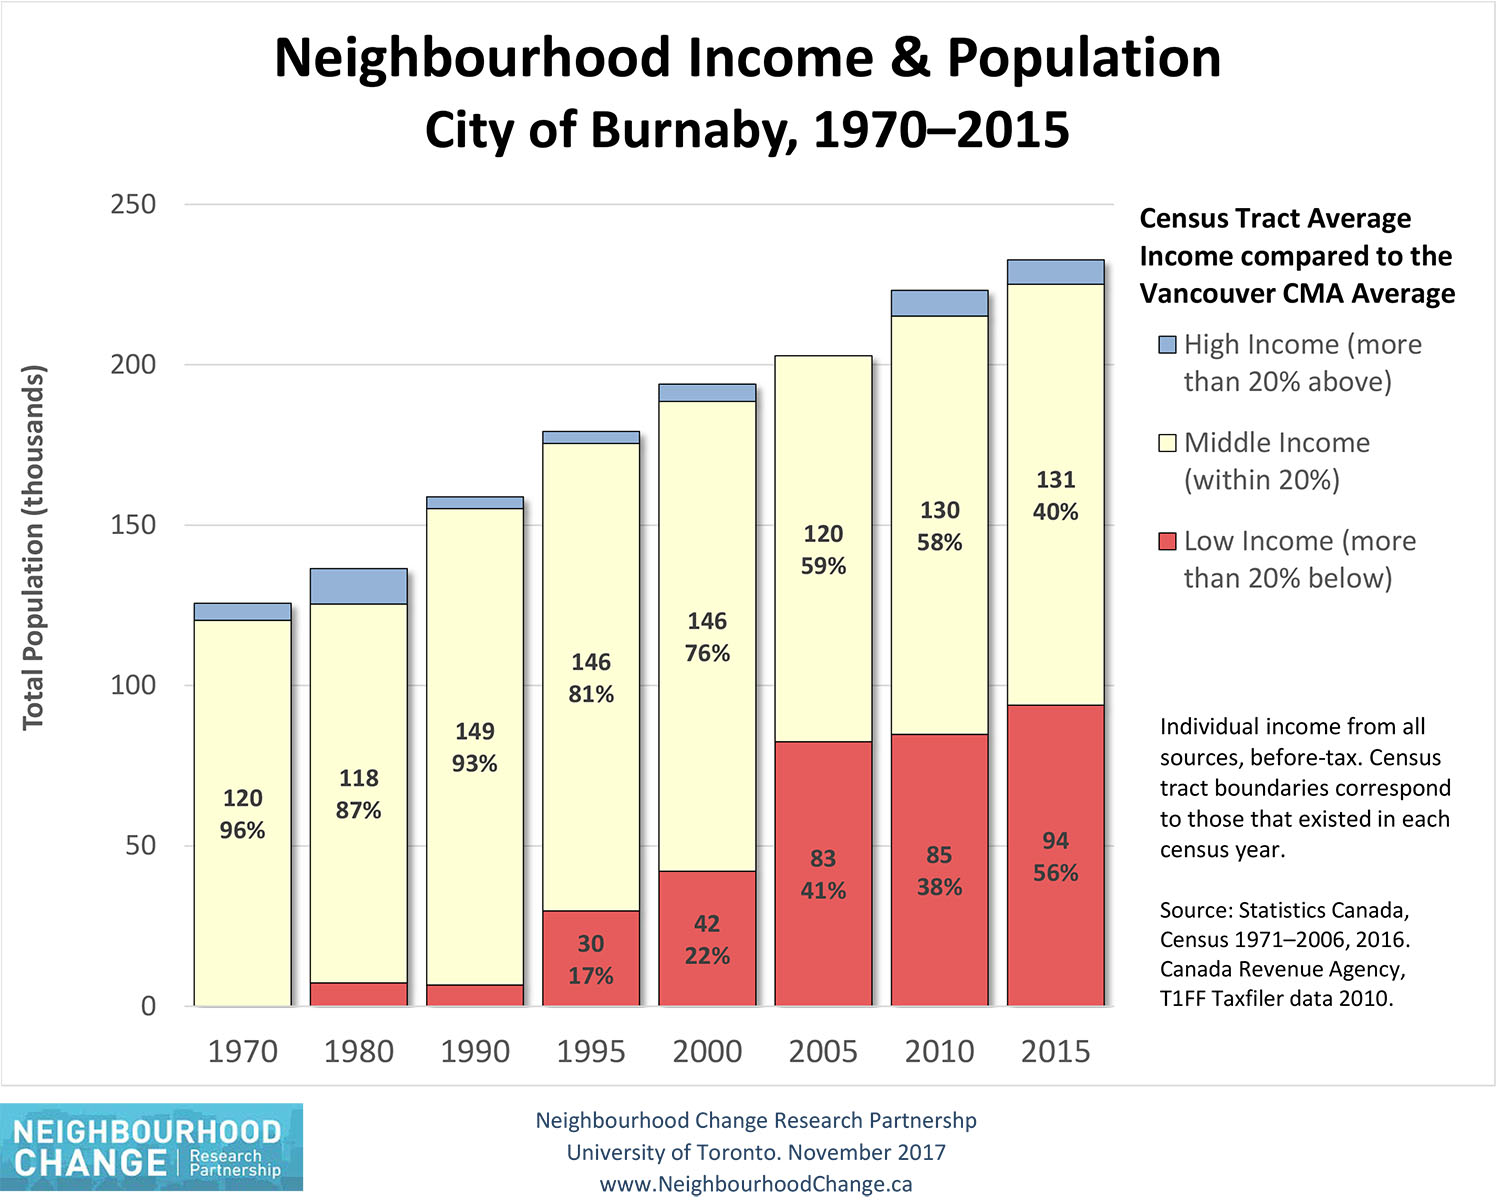
And the changes are most dramatic in places like Burnaby, Richmond and Surrey, once classic middle-income suburban communities.
They had no low-income census tracts in 1970. Now, they make up more than half of the total in each community.
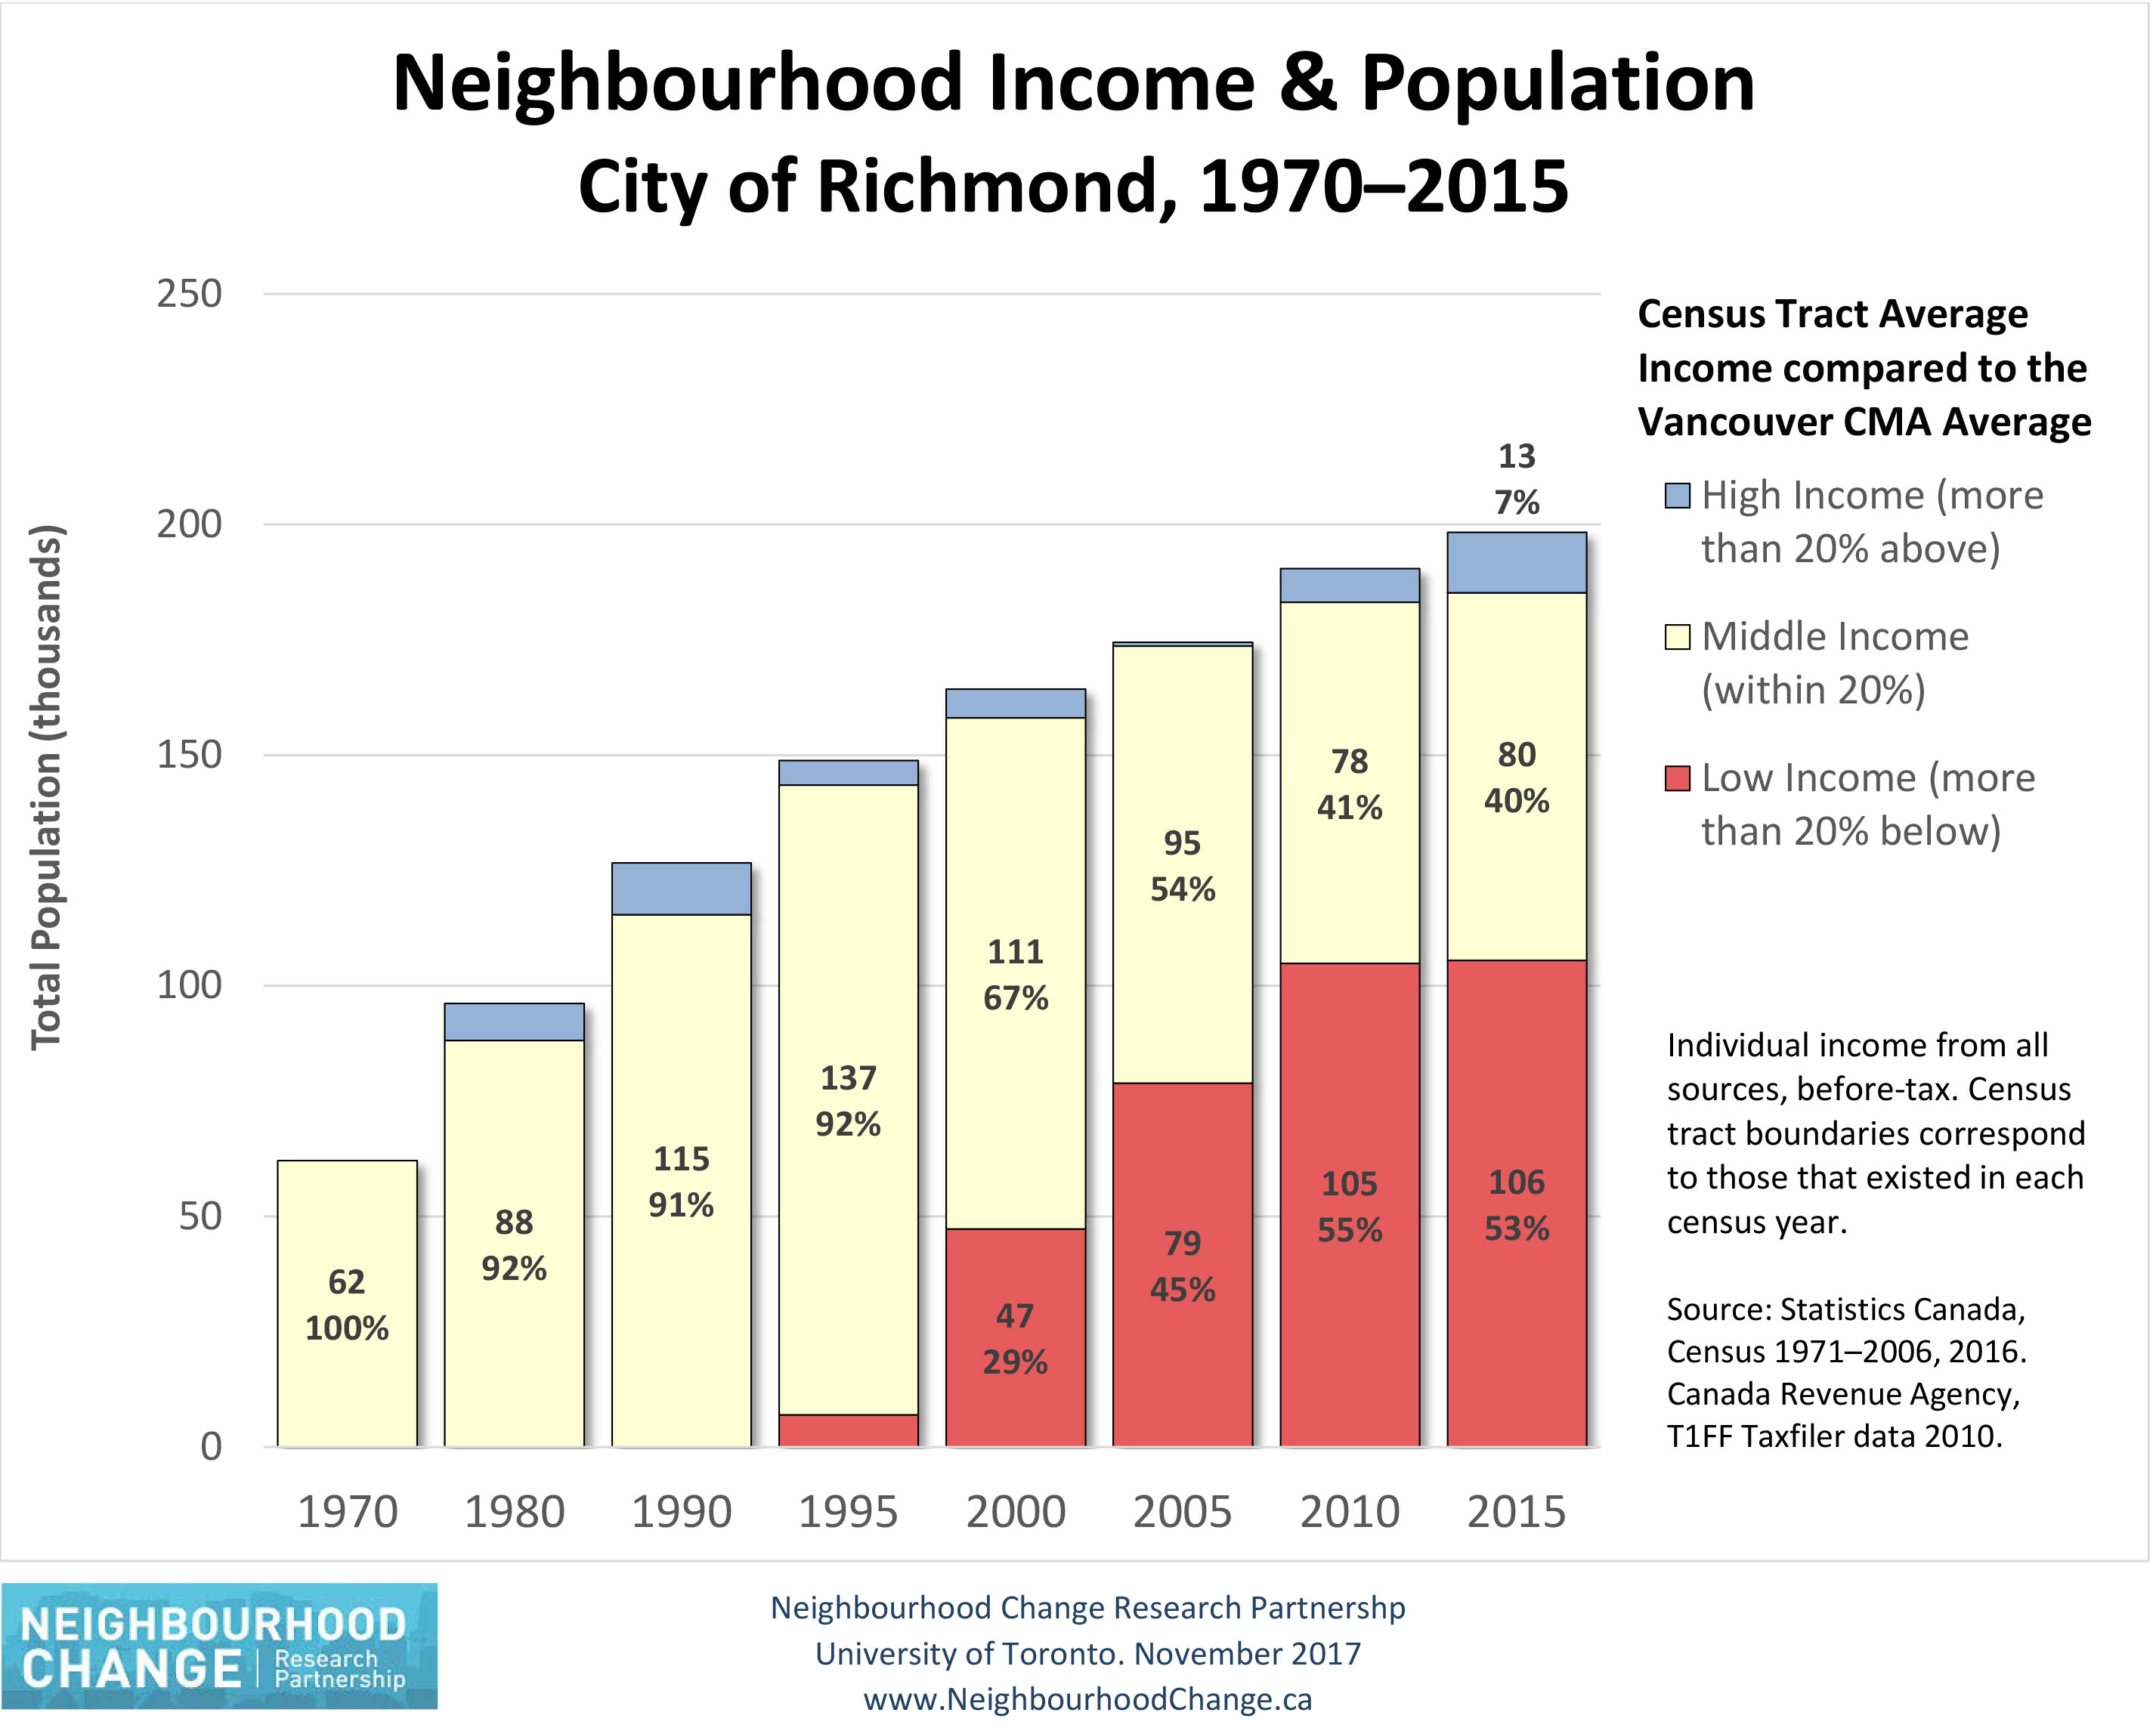
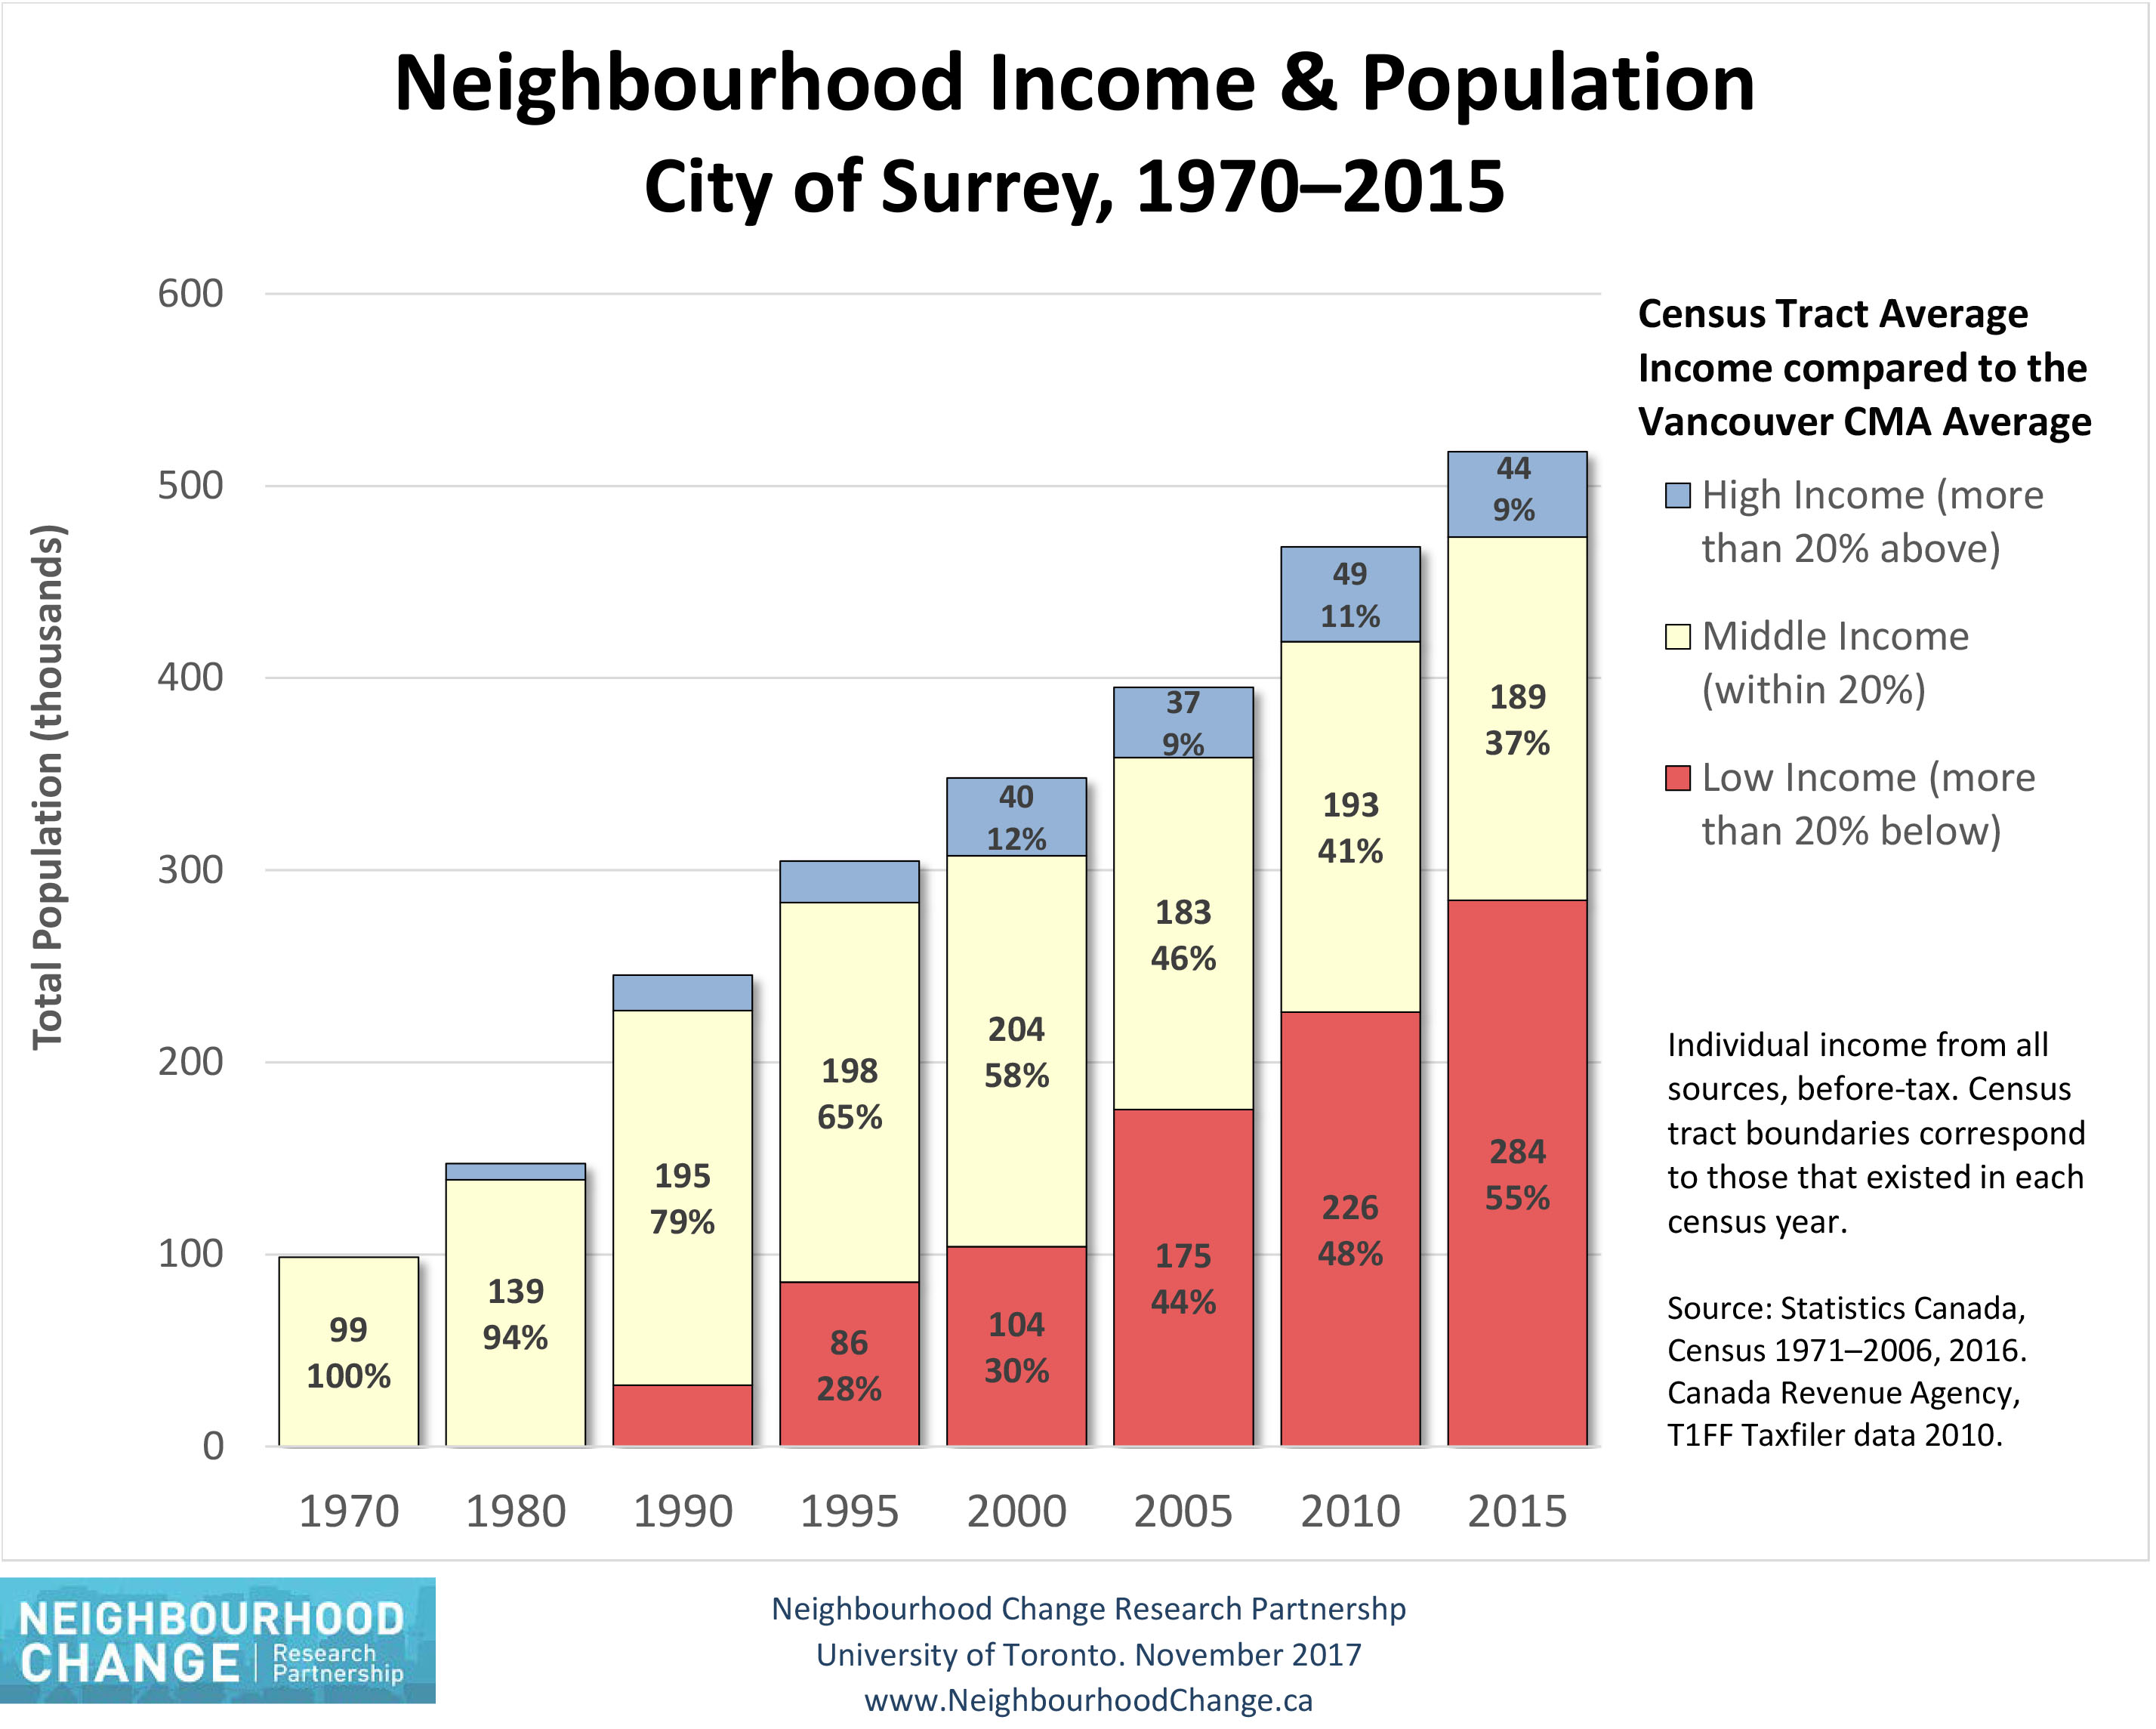
Geographically, people on “the bottom” are pushed out further and further from the region’s urban pockets, said Hulchanski.
In the Metro Vancouver data I crunched, we can see that “the bottom” includes a larger share of visible minorities and immigrants, and that where they live causes them to have longer commutes and makes them more dependent on cars and public transit (which is more expensive because they live further out).
There are side effects to living in a homogenous, high-income area too.
“You lose that ability to mix and to empathize,” said Yan of SFU. “What’s your capacity for empathy if you don’t grow up with it?”
There are many reasons for the trend of polarized incomes: federal and provincial cuts in transfer payments and social assistance, tax cuts, rising housing costs and the disappearance of well-paid manufacturing jobs.
Neighbourhood segregation by income shows no signs of stopping.
In a Vancouver lecture last year, Hulchanski reminded us that this was not caused by an earthquake or a tsunami.
“This is public and private power doing these things to the city,” he said.
And so we have the ability to reverse it. ![]()
Read more: Urban Planning + Architecture







Tyee Commenting Guidelines
Comments that violate guidelines risk being deleted, and violations may result in a temporary or permanent user ban. Maintain the spirit of good conversation to stay in the discussion.
*Please note The Tyee is not a forum for spreading misinformation about COVID-19, denying its existence or minimizing its risk to public health.
Do:
Do not: