Some of the most dangerous propaganda is that which contains just a grain of truth which is then used to mislead. The Campbell government is engaged in saturation advertising at taxpayer expense even though the content of the ads is blatantly political and misleading. Think for a moment how much good could be accomplished if the same effort were put into ads about safe driving or health promotion, but those topics would be less likely to influence a key by-election.
The full page government ad that appeared in the newspapers on October 2nd, repeated much of the TV ads, and included the misleading claim that:
"B.C. is leading the country in job growth with over 154,500 jobs created since December 2001 (Statistics Canada). In fact, over the last three years, employment in B.C. has grown by 8.7 percent, well ahead of the 6.3 percent national average (Statistics Canada). Today, there are more than 40,000 job openings (B.C. Ministry of Skills Development and Labour). And the future looks even better with an estimated 1 million job openings over the next decade (Roslyn Kunin and Associates, Inc.)."
Which jobs, which measures?
There are different types of jobs and different ways of measuring them. Statistics Canada measures paid employment by surveying employers and by using information submitted by employers when income tax is withheld. Using that concept of paid employment from the Survey of Payroll Employment, Earnings and Hours, since December 2001 employment increased by 6.1 percent in Canada and by 5.2 percent in B.C.
Why does the Campbell government use December 2001 as its reference point rather than May 2001 when the last election was held?
Perhaps it is because that starting point exaggerates employment growth. Statistics Canada also uses a definition of employment that not only includes paid employment, but also includes unpaid family workers and the self-employed. That concept of employment is measured by the Labour Force Survey which samples households with a telephone questionnaire. That is the concept used in the government ads. When only paid employment is considered, not much changes in the comparison between B.C. and Canada whether the starting point is May or December 2001. Since May 2001, paid employment increased by 6.1 percent in Canada and by 4.9 percent in B.C. That puts BC slightly farther behind Canadian job growth, 1.2 percent rather than 0.9 percent.
Fiddling with starting date
However, when the Labour Force Survey (LFS) is used to measure employment including more than just paid employment, there is a big difference depending on which starting date is used. That definition gives an increase since December 2001 by 6.3 percent for Canada and by 8.1 percent for B.C. (still lower than the figure used in the government's ad); the increase since May 2001 is 6.2 percent for Canada and 4.8 percent for B.C. When the Labour Force Survey definition of total employment is used, choosing December 2001 as the starting point puts BC 1.8 percent ahead of Canada, but using May 2001 puts B.C. 1.4 percent behind.
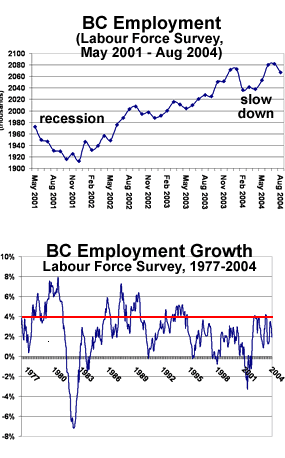
The first graph shown here illustrates employment (the broad LFS concept) in BC from May 2001 through August 2004. Notice that employment declined for the last half of 2001 when BC was experiencing a recession. When economists measure employment growth, they try to separate long run growth from short term business cycles. The government ads cherry pick the numbers so as to overstate long run growth; they include the recovery side but not the down side of the 2001 recession.
There is no single correct method for separating short term cycles and the long term trend. Some of what economists say about the existence of business cycles depends on what method they use to isolate the trend, and anyone can see that the answer depends on what starting and ending points are used as well as what the definition of employment is.
What is a ‘job opening’?
Notice that the government ad uses the words "job openings" when it refers to the work of Dr. Kunin. Job openings are not the same as new jobs. If a half million people retire over the next 10 years and their jobs are filled by young people entering the labour force, then there are 500,000 job openings but no job growth. The second graph shown here illustrates job growth in B.C. (LFS definition) for the last 27 years as measured by percentage change for the same month year over year, for example, August 2004 divided by August 2003. The graph shows that the rate of growth in employment has been declining for almost 30 years.
If B.C. were to really gain 1 million jobs over the next 10 years, as opposed to having 1 million job openings, it would require average annual job growth of just over 4 percent. The longest period in the past 27 years when that rate of growth was achieved was three years in the late 70s. It is inconceivable that B.C. could experience 10 years of 4 percent job growth, but that is not what the misleading ad claims; it just leaves that open to easy misinterpretation when it speaks about job openings in the same paragraph as employment growth.
David Schreck is a political analyst. This piece originally appeared on his web site StrategicThoughts.com ![]()


Tyee Commenting Guidelines
Comments that violate guidelines risk being deleted, and violations may result in a temporary or permanent user ban. Maintain the spirit of good conversation to stay in the discussion.
*Please note The Tyee is not a forum for spreading misinformation about COVID-19, denying its existence or minimizing its risk to public health.
Do:
Do not: