


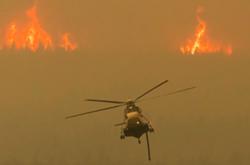
In reporting the series "Bracing for Disasters" that begins today, we started with basic questions that turned out to be not so simply answered. We wanted to know what populations were being most evacuated in B.C. due to disasters and how long, on average, people had to wait before coming home to whatever awaited them.
We had a general sense of who gets hit worse. Rural and remote communities disproportionately “experience social, economic, cultural and health impacts from climate change compared with urban centres,” according to a report by the federal government.
But there was no publicly readily available data that looked at the length of evacuations, what was causing them and what populations were being disproportionately evacuated in our province.
We decided to draw on open data on historic and current evacuations provided by the provincial government and combine it with census data. Working with mathematician and data scientist Jens von Bergmann we brought together evacuation data going back to 2017 and data from Statistics Canada's last two census counts in 2016 and 2021.
Our data scan revealed these estimates:
- People in B.C. are being evacuated for approximately 22 days. That’s much longer than our systems are set up for. (The number we used is the median number of days weighted by population.)
- Ninety-seven per cent of evacuations are lasting more than three days.
- Indigenous people in B.C. are evacuated four times more than non-Indigenous people.
- While the differences were small, people in the bottom half of the income distribution, homeowners and people not in the labour force were more likely to be evacuated over the last six years.
The open data provides information on evacuation alerts and orders. Alerts are issued by emergency officials when a community needs to be ready to leave the area. An evacuation order is given when emergency officials believe it is no longer safe to stay and residents should leave immediately.
An evacuation order is lifted when emergency officials have decided it is safe for people to return home but an alert might still be in effect. Our analysis counted the length of an evacuation as the time from when an evacuation order was given to when there were no more alerts or orders for the area.
Von Bergmann has used census data to help communities better understand the world around them. Through his project, Census Mapper, von Bergmann has made data more easily accessible and understandable. Here’s part of our conversation, edited for length and clarity, on how he helped uncover more information about evacuations in B.C.
Francesca Fionda: Can you walk us through the analysis, Jens?
Jens von Bergmann: From B.C. open data, what we get is information on; evacuation orders, when an order was given, when it was lifted, but also the geographic coverage of that evacuation order. We can take that geographic coverage and you try to see what's that overlap between the region where the evacuation order was given and that region where the census data is on.
It gets a bit tricky when there is overlap [between census geographies and evacuation orders] and you have to make some judgment calls there. It's one line of code that looks at the region's census variables, and also gives me some confidence intervals to see how far out on lunch I am.
Census data from 2016 and 2021 provides a snapshot in time but the evacuation data was over six years. What are some of the considerations you make when estimating the population for evacuated areas?
If an evacuation order was given in 2017, while we have the 2016 census, that tells us something, but probably things changed in the year in between. So we have to make judgment calls there where you have two censuses to deal with.
There are two approaches, we can interpolate between those censuses. If there's an evacuation order sometime between the middle of the 2016 and the 2021 census, then we'll say what’s the halfway point [in population change]?
It's not an exact science, so the idea here is just to understand overall, what likely has happened and who were likely the people that have been impacted.
Yes, it was a bit of a math adventure.
We reviewed for any obvious errors in the evacuation data that was entered. However, the evacuation data recorded by the provincial government will have some instances where an evacuation was not recorded. And those instances might be because official paperwork was not passed along or some data entry errors in transferring data from other datasets. Also, the government’s tracking of evacuations in this dataset began part way through the 2017 wildfires season so it is possible some events were missed in that year.
What other things do you think we might have missed or we weren't able to correct for?
Whenever working with a dataset like this, there are going to be quirks in there. Some of the quirks, you can find by analysis; like are these dates internally consistent?
We've seen some little issues there that we've tried to correct manually by looking at some of those things. We also try to cross check the big events that have a big impact on our analysis, just to see that this checks out broadly. Data is never perfect. That's just the nature of things.
The other part is, of course, that even census data itself is really only an estimate and it's a point in time estimate.
What surprised you about the data?
It's interesting just how many of those events are out there. It's just the sheer number of evacuation orders. It's a lot. What really surprised me too, is the duration of some of them. Sometimes it feels there aren't that many people affected, and then you see events going on for years. Sometimes they really don't affect many people but two years is a long time, even if it's only a few people. ![]()
Read more: Media, Environment


Tyee Commenting Guidelines
Comments that violate guidelines risk being deleted, and violations may result in a temporary or permanent user ban. Maintain the spirit of good conversation to stay in the discussion and be patient with moderators. Comments are reviewed regularly but not in real time.
Do:
Do not: