


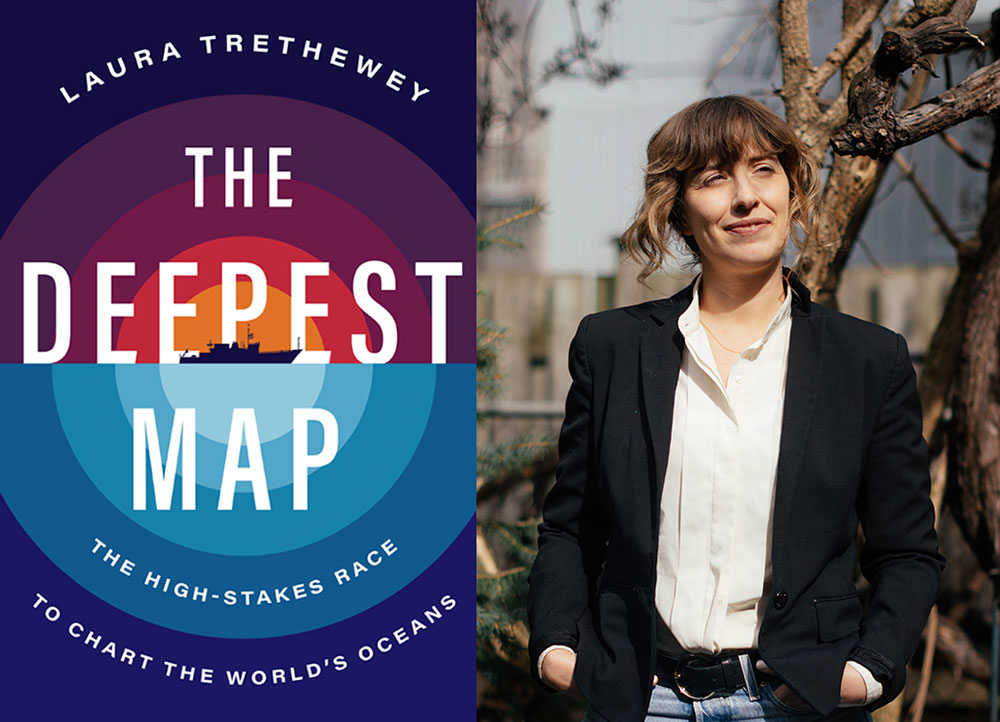
[Editor’s note: "Seawater covers 71 per cent of the planet," ocean journalist Laura Trethewey writes in her new book, ‘The Deepest Map.’ And yet we’re familiar with very little of the seafloor. Increasing that familiarity forms the goal of the Seabed 2030 project, founded in 2017, which aims to create a complete map of the ocean floor by 2030. ‘The Deepest Map’ is a gripping, thoughtful read about the science, the personalities and the extractive industries involved in the race to meet that goal. In the excerpt below, Trethewey joins the crew of the Nautilus, a research vessel owned by the non-profit Ocean Exploration Trust, as they attempt to chart the seafloor off California.]
Every morning on Nautilus, expedition leader Nicole Raineault scrawled the day’s objectives on a whiteboard in the galley. For two days, she wrote simply, “Mapping. If conditions allow.”
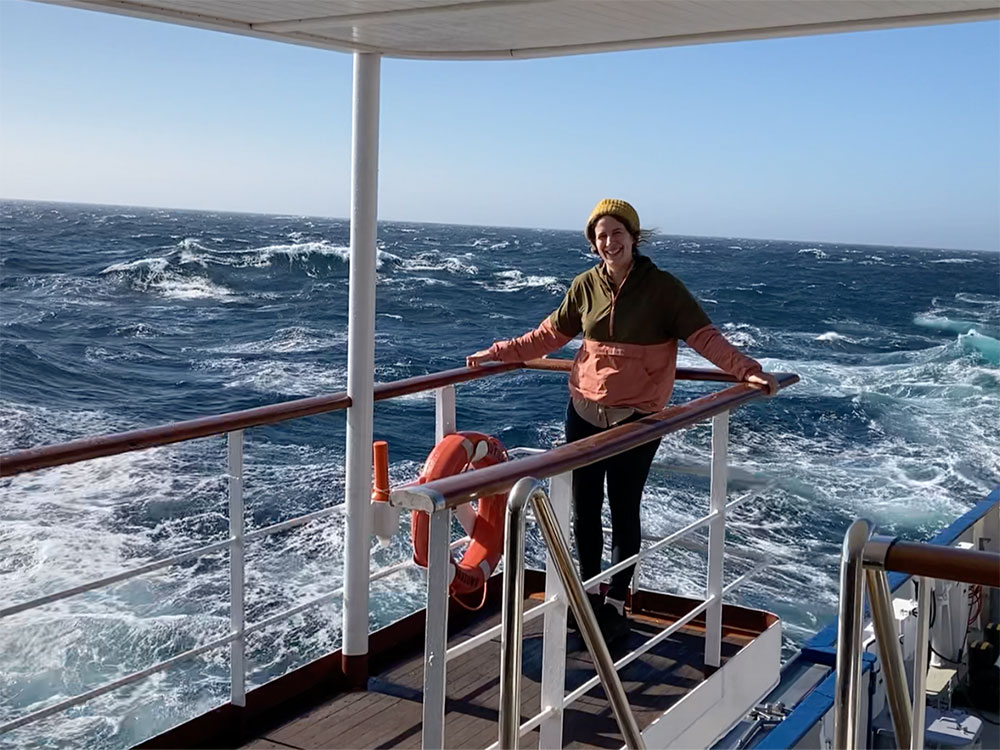
Conditions did not allow. Immediately after we exited the protected channel off Santa Barbara, fierce open-ocean headwinds slammed into Nautilus. Swells of three to six feet rose past nine, 10, 13 feet high. The ship’s bow tipped high into the air over each wave. The winds ratcheted up to 33 knots — 61 kilometres per hour. The ocean was dotted with foamy whitecaps as far as the eye could see. On the Beaufort scale, a mariner’s measure of sea conditions, they were near gale force. On land, it would feel like walking into a heavy storm as your umbrella is ripped from your hands.
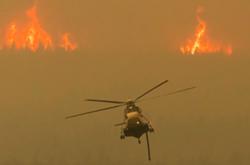
Up ahead was Point Conception, a natural boundary between northern and southern California. North of the point, toward San Francisco and the Bay Area, the land is damper, foggier and taller, with dense forest. South of the point, toward Los Angeles and San Diego, the land is drier, warmer and covered with scrubby deserts and chaparral. It’s a dividing line out at sea, too, where ocean currents collide like the upward drafts of wind buffeting the edge of a cliff.
As we rounded the point, the seas grew taller, rowdier and rougher. Suddenly I had a newfound appreciation of the phrase “smooth sailing.” Out there in the open ocean, it felt like riding a roller coaster gone rogue. Everyday tasks, such as showering and walking, became a challenge. The shower in my cabin was one of those standing-closet affairs fenced in by transparent plastic walls. With one hand against the side, I lathered up quickly with the other hand, feeling a wave rising beneath the ship. Then I stopped soaping and held on for the impact: a moment of weightlessness, followed by a steep drop and a slam back down to the surface. Then I rinsed, bracing for the next slam. Whenever I felt nausea rise in my stomach, I looked down at the water sloshing and churning around my feet in the bottom of the shower, using it as a gimbal inside the windowless room. After I carefully extricated myself from the shower, I dressed as the ship rocked back and forth. A lean over to port, then a lean over to starboard; the rhythm repeated with endless variations and syncopations.
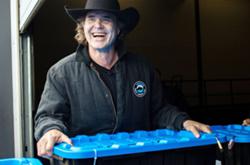
Outside the cabin, I walked, or rather barrelled, down Nautilus’s tight hallways. At the foot of a stairwell, I crossed paths with Renato Kane, an ocean mapper.
“This your first time at sea?” he asked as we held on to a door frame, the stairwell shuddering around us. Kane went to sea so often with Nautilus that he didn’t keep a permanent home on land anymore. I nodded. He raised an eyebrow. “This is… pretty rough for a first-timer.”
The cruise had its sights set on a poorly surveyed stretch off the California coast. In 2019, the Trump administration had thrown its support behind ocean mapping in a presidential memorandum directing the government to create a national strategy for charting the uncharted U.S. EEZ, or exclusive economic zone, mainly along the remote coastlines of Alaska. The U.S. has exclusive jurisdiction over natural resources in their EEZ. The National Oceanic and Atmospheric Administration, or NOAA, had released a map layer that tracked gaps in the map. Research ships such as Nautilus layered the NOAA map over their route through U.S. waters, trying to hit as many gaps as possible.
Using sound to map the seafloor
Whereas land surveyors use the speed of light to map the rise and fall in the terrain, ocean mappers use the speed of sound, like a bat reverberating clicks off the walls of a dark cave. All sonar, from the most basic fish finder to the powerful multibeam bolted to the hulls of E/V Nautilus and DSSV Pressure Drop, follows the same principle. The sonar emits a ping that travels through the water column, bounces off the seafloor and returns to the sonar. One second of travel time is roughly equal to one mile. Divide the ping’s travel time by two, multiply it by the velocity of sound in water and — voila! — you have a measurement of the depth.
Sounds easy, right? Except that the water’s salinity, temperature and pressure, along with a slew of other factors, warp the ping as it travels through the ocean.
Rough weather also complicates the drawing of an accurate, detailed map of the seafloor. The mapping room, also known as the data lab on Nautilus, is one of the worst places in which to sit in high seas. Situated at the near centre of the ship, the open-plan office has very little natural light or fresh air. Three of the four walls are covered in computer screens, streaming live data from all over the ship, while the fourth wall has a tiny row of portholes that are often frothed up by the waves and foam outside.
There are various types of sonars on board Nautilus, and each “hears” the seafloor in a distinct way. The ship crew on the bridge operates a single-beam sonar that sends a single, straightforward ping down to the bottom and back. The single beam reveals a large snapshot of what is immediately beneath the ship, and that’s good enough for the crew, who want to avoid running aground. The single beam sends a single ping, down-up, down-up, down-up, across the seafloor. The multibeam, on the other hand, emits hundreds of pings simultaneously, raining down into the deep like a huge fan of sound.
It works a little like this: Imagine you had to figure out what an unknown object was in the dark, but you could use only one finger. It would take a while to trace its shape — that’s single-beam sonar.
Now imagine you could pick up that object with your whole hand. You would know what you were holding far more quickly. That’s what a multibeam does, and it’s why ocean mappers prefer using it for seafloor surveys: it bathes the seafloor in sound, capturing a clean snapshot of the underwater terrain.
Down in the data lab, I watched new seafloor maps stream on the main computer screen. “What’re we looking at right now?” I asked Renato Kane, who was sitting next to me, cleaning a map from earlier in the day. He glanced over. “Uh… bad data,” he muttered, and went back to removing “flyers” — when a ping bounces off at an odd angle or records the echo of a previous ping — from the maps.
As good as a multibeam might be, it cannot overcome the reality of surveying in high seas. The sonar is mounted to the hull of a moving ship on top of a moving ocean. When Nautilus crested a wave, the multibeam momentarily lost contact with the surface. Then the ship slammed back down again, but the multibeam was still disconnected because it landed on a wake of bubbles so dense that they blocked the sonar beam. Whenever that happened, the connection between the physical computer and the screens in the data lab would drop.
After the sonar latched back onto the ocean surface, the water column reappeared on the screen. It went on like that, flickering on and off in time with the waves, as though we were fiddling with the antennae on an old TV. It also meant that we were potentially losing hundreds of soundings in the ocean. “Little lost pings,” as one mapper put it poetically. On another screen, those lost soundings smeared an arc under the ship that looked a little like the Joker’s infamous messy smile. Kane was working as fast as he could, but the flyers were everywhere.
On the main computer screen there were six separate windows to watch, with two larger windows that showed the ship’s current track line and the water column beneath the ship. The water column window looked a bit like a fetal ultrasound. But rather than the grainy black-and-white profile of an unborn baby, it spotlighted the seafloor beneath us in a cone of sound. At the apex of the cone was the ship and then beneath that the surface water in bright royal blue. Farther down came a swarm of turquoise dots: hundreds of millions of plankton, squid and fish. At night, the swarm rises to feed in the surface waters, and during the day it sinks back down to hide from predators in the dark.
This is the world’s largest daily migration by biomass. During the Second World War, scientists working with the U.S. navy first spotted it while running sonar experiments and hunting enemy submarines off the coast of California. The layer was so thick with fish and plankton that it looked as though the seafloor was moving up and down throughout the day. The scientists who discovered the layer dubbed it the “false bottom.”
The scattering layer is quite beautiful to watch. One mapper on board Nautilus told me that she clocked her day around that layer, watching the animals move up and down the ocean, the underwater equivalent of the rising and setting sun.
Sonar and echolocation
By its very nature, mapping the seafloor involves introducing more sound into an already noisy ocean. A wide cross section of marine animals shows a range of ill effects from exposure to human-made noise.
The flagship animal for studying the underwater racket is the beaked whale, a highly sensitive deep-diving predator that orchestrates unique diving patterns and calls, even co-ordinating dives with the other members of the pod to avoid their most feared predator, the killer whale. Midfrequency active sonar, used by the navy for antisubmarine warfare, appears to alarm them. The whales stop foraging and echolocating and swim away from the source of the sound at an abnormally steep angle, which could cause them to suffer from decompression sickness, or “the bends” — similar to the illness scuba divers get when they surface too quickly and develop poisonous nitrogen bubbles in their blood. Since midfrequency naval sonar was introduced in the 1960s, there have been dozens of beaked-whale strandings linked to naval exercises or occurring near navy bases and ships.
“At the moment, a lot of research has gone into understanding the effects of naval sonar and shipping noise on marine mammals,” said Annamaria DeAngelis, a NOAA biologist. These are the two types of noise pollution that have the most obvious impacts on marine mammals.
According to DeAngelis, the scientific community tends to regard mapping sonar as low impact because the sonar’s range is limited to the water beneath the ship. But the research is still early, and DeAngelis and others are running experiments to test whether that long-held assumption is true. She has suggested swapping out survey ships for autonomous underwater vehicles, because they travel underwater closer to the seafloor and impact a smaller area.
Back on the main computer tracking Nautilus’s sonar, at the very bottom of the water column, came the seafloor: a wobbly red line that revealed that the pings had hit pay dirt.
In smooth sailing, the multibeam creates a rainbow-bright map of the seafloor — a bathymetric map, to use the proper scientific term. A bathymetric map is a hallucinogenic thing to behold. The multibeam sonar lights up the seafloor with sound, casting a rainbow across mountains and valleys, each colour indicating a different depth. The reds and yellows represent the shallower seafloor; then come the greens, the blues, and finally the purples of the deep. This is similar to the colour-coding found on terrestrial maps, but to the average viewer, bathymetric maps look surreal, sci-fi, almost otherworldly.
I’ve heard ocean mappers wax poetic over the beauty of a seafloor map, describing a new chart of an Alaskan fjord as though it were a great work of art. They know how much work went into its creation, so every granular dimple and pockmark in the bottom is precious. They also usually have a geological background, so their eyes are trained to read the terrain for clues about the distant past and the coming future. They might be able to point to where an ancient river once drained into the ocean or where an island eroded into a seamount. They might be able to warn you about the buckling sides of a trench and a coming tsunami. All of this invisible earth, covered by ocean, is suddenly made visible.
“I think it can be hard for people who see the rainbow-coloured maps to get a real image [of the seafloor],” Nicole Raineault told me. “But imagine draining the ocean and being able to see all the mountains, all these Grand Canyon systems that are on the seafloor. It’s incredible to see that. And in many cases where we’re mapping, we’re the first people to see that.”
But to be honest, the maps we were making off California that day were not so pretty. The survey looked like a long, ragged technicolor tiger stripe. On the second day of the mapping cruise, Renato Kane decided to shut down the multibeam sonar altogether, something that was rarely done.
“It’s grumpy, like an elderly person. You don’t fuck with it,” explained Erin Heffron, another mapper on board.
By that point, though, we were collecting more bad data than good. Rather than send bad maps of the seafloor to Seabed 2030, the mappers chose to wait for calmer seas.
Excerpt from pages 33 to 39 was originally published in ‘The Deepest Map: The High-Stakes Race to Chart the World’s Oceans.’ Copyright 2023 by Laura Trethewey. Reprinted by permission of Goose Lane Editions. ![]()
Read more: Books, Science + Tech, Environment


Tyee Commenting Guidelines
Comments that violate guidelines risk being deleted, and violations may result in a temporary or permanent user ban. Maintain the spirit of good conversation to stay in the discussion and be patient with moderators. Comments are reviewed regularly but not in real time.
Do:
Do not: