


Forecasting election results is hard. Predicting who will turn out to vote tomorrow in the United States is not.
The rich are more likely to vote than the poor. The better educated are more likely to vote than the less educated. White people are more likely to vote than racialized Americans.
As a scholar who has studied trust and how it matters for years, I can say that generalized trust — an expectation of good will and benign intent of others — is also a powerful predictor of voter turnout.
Whomever they vote for, Americans who are trusting are more likely to have either cast their ballots already or will on election day than Americans who do not trust easily.
Trust inequality can explain disparity in voter turnout. My research shows that, regionally across the United States, trust is lower in the South, and Southerners are less likely to vote. I also show that those who feel they have less power in society are less able to trust. This can, at least partly, explain why the poor and racialized Americans are less likely to vote.
The promise of democracy in part rests on citizens being able to trust equally.
My study of elections relies largely on turnout data from post-election surveys. Two major ongoing surveys that document voter turnout in the U.S. are the American National Election Studies and the U.S. General Social Survey.
Post-election surveys often overestimate voter turnout due to various reasons. Nonetheless, they are useful for studying, for example, how race, gender and socioeconomic class might shape voting behaviour, so I’ve included data from both surveys in my research.
Previous research has also suggested that trust plays an important role in political participation. Voting is a typical form of political participation. That means we would expect voter turnout to be higher among Americans who trust than those who do not trust easily.
In many surveys, the widely used statement to measure overall trust is: “Generally speaking, would you say that most people can be trusted or that you cannot be too careful in life?” This statement was part of both the ANES and the GSS surveys.
My analysis of the data from both surveys shows that Americans who think “most people can be trusted” are much more likely to vote than those who think “you cannot be too careful in life.” The pattern is also highly consistent when I separate the analysis on a yearly basis. Higher trust is associated with a higher turnout in every U.S. presidential election since 1948.
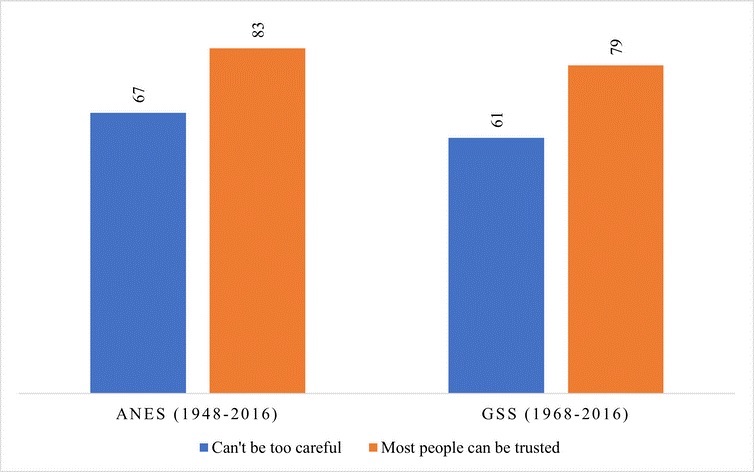
Taking into account race, gender, age, level of education and household income, as well as the year of the election, Americans who trust are about 70 per cent more likely to vote than those who do not trust, regardless of which survey we use (72 per cent from ANES; 70 per cent from GSS).
Trust impacts Republicans more than Democrats
But does trust affect Republican voters and Democrat voters differently? To answer this question, I compare turnout gaps between “trusters” and “mistrusters” among Republican voters and Democrat voters.
The graph below shows that overall the voting gap between trusters and mistrusters is greater among those who vote Republican than those who vote Democrat. Specifically, based on the cumulative data from ANES (1948-2016), the left side of the graph shows that while the voting gap between trusters and mistrusters is only about one percentage point (38 per cent versus 37 per cent) for Democratic voters, the gap is 13 percentage points for Republican voters (40 per cent versus 27 per cent).
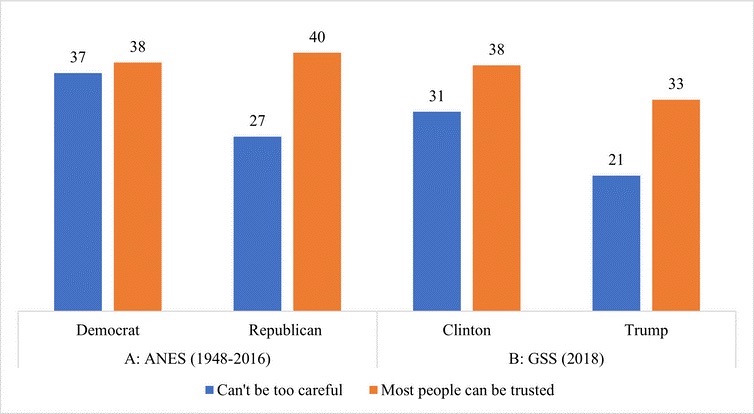
The right side of the graph focuses on the 2016 election only using data from the 2018 GSS. It shows that while the voting gap between trusters and mistrusters was seven percentage points among Clinton voters, the gap was 12 percentage points among Trump voters.
These findings suggest trust has a greater impact on Republican voters than those who vote Democrat.
Why are minorities less likely to vote?
Racialized Americans are often found to have a low voter turnout. The Pew Research Center reported that the turnout rate in the 2016 presidential election was 65.3 per cent among white registered voters, 59.6 per cent among Blacks, 49.3 per cent among Asians and 47.6 per cent among Hispanics.
Common explanations for why minorities are less likely to vote include voter suppression and systematic discrimination. However, in his recent book The Turnout Gap, political scientist Bernard Fraga has argued instead it’s the sense of political inequality that largely explains the majority-minority gap in turnout.
Trust is associated with control, political efficacy and sense of political empowerment. Can minorities’ lower trust explain their lower turnout?
To show how trust can help explain the turnout gap across racial groups, I estimate the average probability of voting for white people, Black people and other racialized Americans using data from both surveys. The base model includes race and year variables, while the second model adds a trust variable to the base model. Here’s a visualization:
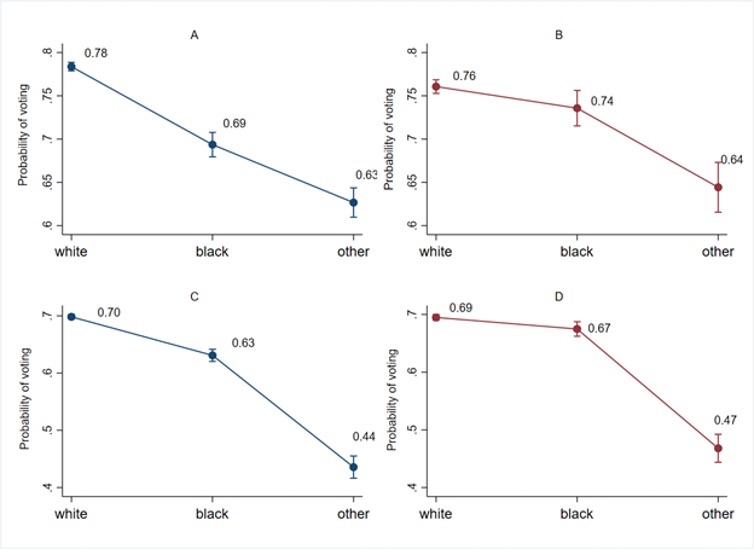
Graph A shows that the average turnout rate among white voters over an 18-year span is 78 per cent, 69 per cent among Black voters and 63 per cent among other racialized Americans.
When taking into account the trust differences among these groups, these numbers become 76 per cent, 74 per cent and 64 per cent respectively per Graph B. In other words, the relative gaps in turnout have become significantly smaller. For example, the gap between white voters and Black voters in Graph A is nine percentage points, but after controlling for trust, it’s only a relatively insignificant two percentage points. These findings are based on the ANES data. Replicating the analysis using data from the GSS shows a consistent pattern. See Graphs C and D.
What does this show us in broader terms?
Democracy only works well when citizens participate in the democratic process and participate equally. But in the United States, lack of trust is eroding democracy’s promise. ![]()
Read more: Politics


Tyee Commenting Guidelines
Comments that violate guidelines risk being deleted, and violations may result in a temporary or permanent user ban. Maintain the spirit of good conversation to stay in the discussion.
*Please note The Tyee is not a forum for spreading misinformation about COVID-19, denying its existence or minimizing its risk to public health.
Do:
Do not: