Hundreds of North Americans — and perhaps many more yet to be tallied — have died of heat-related illness over the past week after a mind-boggling heat wave struck the U.S. Pacific Northwest and far southwestern Canada. It’s virtually certain to be the deadliest weather event on record for the region. The unprecedented death toll is the result of a heat onslaught more intense by some measures than anything in global records, yet very much in line with the expected impacts of a human-warmed climate.
The poster community of this horrific episode has to be Lytton, British Columbia. The town broke Canada’s long-standing all-time national high temperature of 45 C with a high of 46.6 C on June 27. The next day brought 47.9 C, and Tuesday a stunning 49.6 C.
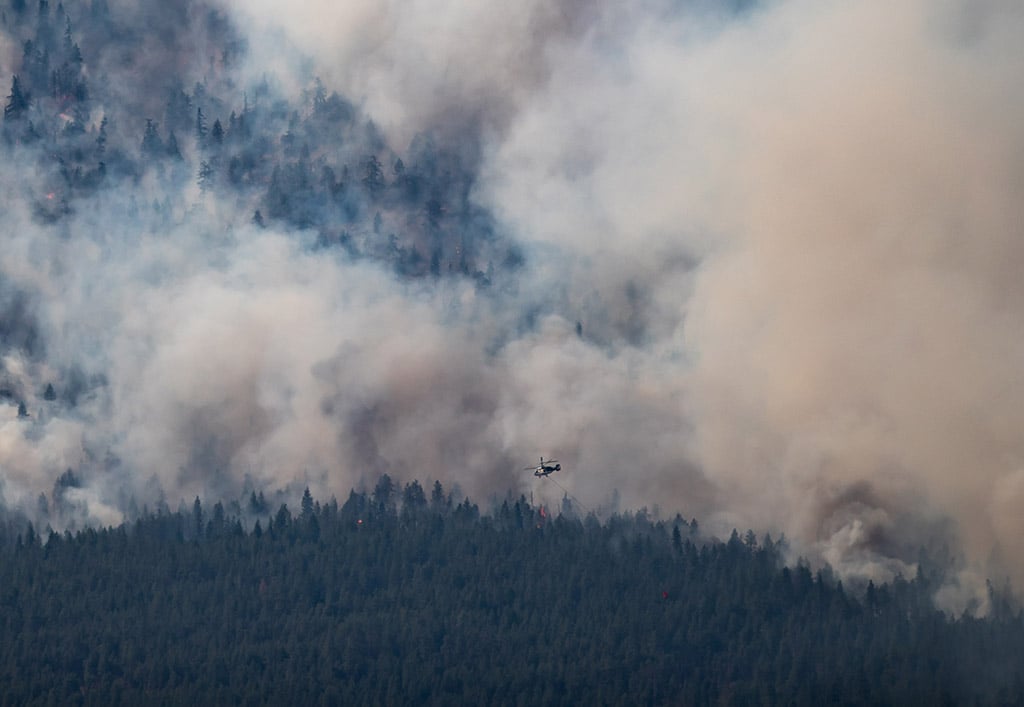
The intense heat flash dried the rugged, forested landscape, and wildfires mushroomed across the area on June 30. By evening, the entire town of Lytton was under mandatory evacuation orders, and Mayor Jan Polderman told CBC News that “the whole town is on fire.” Most homes in Lytton have been destroyed, according to provincial authorities.
Lytton is home to the Lytton First Nation, a Nlaka'pamux band. In Canada and beyond, Indigenous people are disproportionately affected by climate impacts and Indigenous knowledge has much to contribute to climate solutions. https://t.co/Pgn8Xucvxz
— Prof. Katharine Hayhoe (@KHayhoe) July 1, 2021
The lightning from the dry thunderstorms (pyrocumulonimbus) that developed was so intense that over 700,000 intracloud and cloud-to-ground lightning flashes were recorded in 15 hours, including more than 100,000 cloud-to-ground strikes. That’s about five per cent of the total number of lightning flashes Canada typically sees in an entire year.
The fires have generated huge clouds of choking smoke that put air quality in the red “Unhealthy” range in Kamloops, B.C. on Thursday.
I've watched a lot of wildfire-associated pyroconvective events during the satellite era, and I think this might be the singularly most extreme I've ever seen. This is a literal firestorm, producing *thousands* of lightning strikes and almost certainly countless new fires. #BCwx https://t.co/jS0DrJldR3
— Daniel Swain (@Weather_West) July 1, 2021
A grim tally
This heat disaster’s tragic nature is evident even in initial data. B.C. has reported 719 sudden deaths, three times more than usual for this time of year. At least 16 people died of heat-related causes in Seattle. And in Multnomah County, Oregon, which includes Portland, the county medical examiner announced in a poignant news release on Wednesday that 45 residents had died as a result of excessive heat.
“The preliminary cause of death is hyperthermia,” the county said. “The people who died ranged in age from 44 to 97 and include 17 women and 27 men…. Many had underlying health conditions. Many of those who died were found alone, without air conditioning or a fan.”
Similarly, many of those who died in B.C. were found alone in unventilated homes, according to the chief coroner, Lisa Lapointe, as cited by BBC.
The eventual death toll from this heat wave is likely to be much higher than current estimates, according to Kristie Ebi, a professor of global health at the University of Washington. Death certificates need to be gathered and analyzed from multiple areas, and the underlying and contributing causes of death ascertained (a challenge in itself). So it can take months to fully calculate the number of “excess deaths” related to a regional heat wave, as explained in detail in a Yale Climate Connections post last December.
“Those numbers are only going to go up,” Ebi said. Focusing only on factors such as heat stroke “gives you a massive underestimate of the overall [death toll].” Many heat wave deaths are triggered by respiratory and cardiovascular failures often under-recognized as being related to the torrid, often-polluted air of a heat wave.
If there’s one thing Ebi wants to avoid, it’s thinking of this catastrophic heat wave as the “new normal,” which she calls “really misleading” as it actually underestimates the gravity of the situation. “It implies we’re going from one state to another state. We’re in a period when there’s going to be ongoing change for decades.
“The new normal is not the current temperature. The new normal is the constant change.”
Otherworldly heat records
Never in the century-plus history of world weather observation have so many all-time heat records fallen by such a large margin than in the past week’s historic heat wave in western North America. The only heat wave that compares is the great Dust Bowl heat wave of July 1936 in the U.S. Midwest and southcentral Canada. But even that cannot compare to what happened in the northwestern U.S. and Western Canada over the past week.
“This is the most anomalous regional extreme heat event to occur anywhere on Earth since temperature records began. Nothing can compare,” said weather historian Christopher Burt, author of the book Extreme Weather.
Pointing to Lytton, he added, “There has never been a national heat record in a country with an extensive period of record and a multitude of observation sites that was beaten by [a few degrees Celsius].”
International weather records researcher Maximiliano Herrera agrees. “What we are seeing now is totally unprecedented worldwide,” said Herrera, who tweeted on June 30, “It’s an endless waterfall of records being smashed.”
Some examples of the extremity of this event, based on preliminary data:
- Portland, Oregon, broke its long-standing all-time record high 41.6 C (from 1965 and 1981) three days in a row — a stunning feat for any all-time record — with highs of 42.2 C on June 26; 44.6 C on Sunday; and 46.6 C on Monday. That 44.6 C is higher than the average daily high on June 28 at Death Valley, California.
- Quillayute, Washington, broke its official all-time high by reaching a truly astonishing 43.8 C, after hitting 43.3 C on Monday (old record: 37.2 C on Aug. 9, 1981). Quillayute is located near the lush Hoh Rain Forest on the Olympic Peninsula, just three miles from the Pacific Ocean, and receives an average of 100 inches of precipitation per year.
- Jasper, Alberta, broke its all-time high of 36.7 C four days in a row, June 27 to 30, with highs of 37.3 C, 39.0 C, 40.3 C and 41.1 C.
- All-time state highs were tied in Washington (47.7 C at Dallesport) and set in Oregon (47.7 C at Hermiston, beating the reliable record of 47.2 C), and provincial highs were smashed in B.C. (49.6 C at Lytton, beating 39.1 C) and Northwest Territories (39.9 C at Fort Smith, beating 31.7 C).
According to Herrera, more all-time heat records have been broken by at least 5 C in the past week’s heat wave than in the previous 84-plus years of world weather recordkeeping, going back to July 1936. It’s worth noting that the record North American heat of the 1930s, including 1936, was largely connected to the Dust Bowl, in which the effects of a multiyear drought were amplified by over-plowed, denuded soil across the Great Plains — an example of human-induced climate change itself, albeit temporary.
Preliminary data from NOAA’s U.S. records website shows that 55 U.S. stations had the highest temperatures in their history in the week ending June 28. More than 400 daily record highs were set. Over the past year, the nation has experienced about 38,000 daily record highs versus about 18,500 record lows, consistent with the 2:1 ratio of hot-to-cold records set in recent years.
What next?
The hellish heat dome that developed over the hardest-hit areas in this heat wave has now weakened and shifted east, though unusually hot conditions remain over a large part of the northern U.S. and Western Canada.
Unrelenting drought has only intensified in recent weeks across the western U.S., where the overall extent of drought is at its highest level since the U.S. Drought Monitor was established in 2000. As of June 29, severe to exceptional drought (levels D2 to D4) covered 81 per cent of the West, the first time on record that index has gone above 80 per cent.
Meanwhile, a downstream buckling of the jet stream has led to an unusually mild, wet week from the Southern Rockies into the Midwest, though nothing close to record-setting on the same level as the heat wave. Oklahoma City received nearly seven inches of rain in the last week of June, and parts of Detroit saw six to eight inches of rain on June 26, triggering widespread high-impact flooding.
It’s now July, the hottest month of the year in the Northern Hemisphere, and extreme ridges of high pressure forming in July have a good chance of setting all-time heat records. Unfortunately, the latest 10-day forecasts from the Global Forecast System and European models predict that the western U.S. will have an unusually intense ridge of high pressure capable of overthrowing more all-time U.S. heat records July 10 to 12.
By one common measure, the 12Z Thursday run of the global forecast model is predicting that the heat dome at the centre of this upper-level high will be nearly as strong as any ever observed. Warm air expanding at lower levels pushes up the height of the 500-millibar surface, roughly at the midpoint of the atmosphere, vertically. The 500-millibar height is predicted by the ensemble model average to exceed 598 decametres over the southwestern U.S. on July 11; the operational version of the model predicted 601 decametres. The record-high 500-millibar height at Las Vegas, Nevada, as measured in twice-daily weather-balloon launches (soundings) since 1948, is 602 decametres.
Ten-day forecasts of this nature are often inaccurate, so the coming heat wave may fall short of setting all-time records. Nevertheless, with record drought gripping the region, even an average-strength heat wave could boost the odds of significant wildfire activity. ![]()
Read more: Science + Tech, Environment


Tyee Commenting Guidelines
Comments that violate guidelines risk being deleted, and violations may result in a temporary or permanent user ban. Maintain the spirit of good conversation to stay in the discussion.
*Please note The Tyee is not a forum for spreading misinformation about COVID-19, denying its existence or minimizing its risk to public health.
Do:
Do not: