


The provincial economy, to no one's surprise, has become a defining issue in the early days of B.C.'s 39th general election campaign.
"Under Gordon Campbell's watch, B.C. has seen unprecedented job losses -- 22,000 last month alone, the worst net job loss in Canada," charged Carole James as she kicked off the New Democratic Party campaign. "And we've lost almost 80,000 jobs since Campbell announced his economic plan last fall."
For his part, Gordon Campbell opened the BC Liberal effort by drawing a stark choice for voters on May 12: "British Columbians will decide whether to re-elect a government that is leading B.C. forward or whether they are prepared to let the NDP take B.C. back to the failed policies of the 1990s."
Is either of those allegations true? Did B.C. suffer grievous harm from NDP policies in the 1990s? Have BC Liberal policies caused thousands of British Columbians to lose their jobs in the current recession?
Just the facts
It shouldn't be too difficult to perform an objective analysis of the province's economic performance under both the New Democrats and BC Liberals over the last couple of decades. Probably the easiest way is to examine the growth of B.C.'s economy (as measured by gross domestic product) and compare it to that of Canada as a whole over the same period.
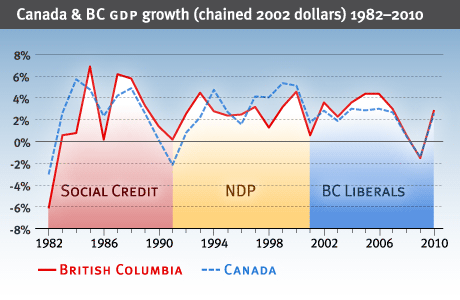
The above chart shows the annual increases in real GDP (in chained 2002 dollars) for both British Columbia and Canada from 1981 to 2007. The data is generated by Statistics Canada (see Table 3, here) and reproduced for our province by BC Stats here.
Because Statistics Canada's data go only to 2007, estimates of GDP growth for 2008-10 were obtained from economic analyses by the Royal Bank of Canada. (See page two, here) The commercial bank estimates that B.C.'s chain-weighted GDP increased by a slim 0.6 per cent in 2008, but forecasts a decline of 1.5 per cent in the current year, followed by an increase of 2.9 per cent in 2010.
(Other banks and organizations have published different estimates and forecasts of B.C.'s GDP growth, from 2008 through 2010. BMO Capital Markets, for example, is much more pessimistic than the Royal, putting B.C.'s GDP decline this year at 2.4 per cent, and the 2010 recovery at just 1.9 per cent.)
Declines, then and now
Let's start with a few general observations. Thankfully, economic contractions have been relatively rare in Canada over most of the last century, with just nine years of decline since 1926 (when the then-Dominion Bureau of Statistics began tabulating economic growth).
Three of those years (1930, 1931 and 1932) were at the beginning of the Great Depression, and two more (1945 and 1946) occurred when armament production ramped down at the conclusion of the Second World War. Canada's economy also fell slightly for similar reasons in 1954, at the end of the Korean War.
The other three instances of economic decline in Canada are captured in the chart above. In 1982, the national economy shrank by 2.9 per cent; a decade later, in 1991, it retreated by 2.1 per cent.
In the current year, 2009, the Royal Bank believes Canada's GDP will fall by 1.5 per cent.
BC's imperfect mirror of Canada
The chart also shows that B.C.'s rate of economic growth generally adheres to that of Canada as a whole. That is, when the nation's economy expands, so does that of our province. And when Canada's economy weakens, British Columbia's does as well.
This should not be surprising. After all, to a large extent the economic well-being of Canada and most of her provinces -- and especially B.C. -- relies on the development of natural resources. When world-wide commodity prices rise, our nation prospers. Conversely, when global demand for our natural resources weakens, our national and provincial economies do less well.
Of course, as the chart above also illustrates, B.C. does not follow in exact lock-step with the national economy. For example, it is evident that the 1982 recession was nearly three times as severe in our province -- where the economy contracted by more than six percent -- than it was for Canada as a whole.
Then, a decade later, B.C. avoided the worst effects of the painful and lengthy recession that struck much of Canada and the United States. Although the overall Canadian economy fell by more than two per cent in 1991, B.C. managed to stay in positive territory, albeit by a minuscule 0.2 per cent.
Today, it is evident that Canada and B.C. are simultaneously enduring a distressing economic downturn. The precise depth and duration of this contraction will not be known for at least a couple of years, however.
So, let's go back over the last few decades and dig just a little deeper into the numbers, because there is a fascinating story of B.C.'s economic performance under three different governing parties.
1982-1991: SOCIAL CREDIT'S LAST DECADE IN POWER
As the chart above clearly illustrates, B.C.'s economy during the Socreds' final decade in office was marked by dramatic, tumultuous swings. In 1982, real GDP plunged by an incredible 6.1 per cent (which presaged Bill Bennett's historic "Restraint" program); three years later, in 1985, it exploded upward by an equally stunning 6.9 per cent.
The following year it again plunged to a picayune 0.2 per cent, but in 1987 and 1988 it skyrocketed to 6.1 per cent and 5.8 per cent respectively. Three years later, however, in 1991, economic growth crashed once again to just 0.2 per cent.
To reiterate a point made earlier, B.C.'s wild economic performance was not unlike that of Canada's over the same period. But, as the chart above shows, our province's highs and lows were more exaggerated than those of the nation as a whole.
One explanation for weak economic growth over the period is that the early 1980s marked the beginning of a two-decade-long decline in global commodity prices. (See chart on page four of the latest ScotiaBank Commodity Price Index Report, here.) Growth in B.C.'s resource sector fluctuated along a downward trajectory, as forest production (notably lumber and pulp) stagnated and mining activity went into a long, slow slide.
But at the same time, B.C. was the beneficiary of an extraordinary population boom, created largely by inter-provincial and international in-migration. It lasted roughly from just after Expo '86 to the transfer of Hong Kong to the People's Republic of China in 1997. And when it had ended, B.C. had added close to 1 million people -- the population grew from 3 million to 3.95 million -- in a single decade.
As a consequence of the population boom, the province embarked on a massive construction boom -- houses, schools, hospitals, roads and more -- which acted to offset weakness in the natural-resource sector.
THE 1990s: BC UNDER THE NDP
In comparison to its wild performance with Social Credit in the 1980s, B.C.'s economy in the 1990s under New Democratic Party government was, well, bland. The NDP recorded two years of four per cent-plus growth (4.5 per cent in 1993, at the beginning of their decade in office, and 4.6 per cent in 2000, at the end), and just a single year under two percent (1.3 per cent in 1998). All of the remaining years were between two and four per cent.
Surprisingly -- in light of criticism fostered by B.C.'s business community, and perpetuated by Gordon Campbell's BC Liberals -- not once during the New Democrats' tenure did British Columbia record negative economic growth. That's in contrast to the sharp downturn in 1982 with Social Credit, and the current recession under the BC Liberals.
How, then, to explain the perception that the 1990s was a period of economic decline, a so-called "dismal decade"?
Look again at the chart above and note that B.C.'s annual economic growth, from 1987 through 1993, and then again in 1996, exceeded that of Canada as a whole. But in 1994 and 1995, and then again from 1997 until 2001, the B.C. economy under-performed Canada's. It is that latter period, the last four years of New Democratic Party government, that NDP critics point to as proof of their alleged incompetence and mismanagement.
Let's remember two key points about B.C.'s economy during the 1980s and 1990s. First, both decades were marked by a decline in global commodity prices, from which B.C. arguably suffered more than most other Canadian provinces.
Second, B.C. had that historic population boom from 1987 to 1997. Because Canada's economy was much weaker than B.C.'s over the period, thousands of workers from across the country moved to the Pacific province in search of employment.
Global migrants boosted economy
In 1986, the year of Expo, B.C. had a net loss from inter-provincial migration (minus 772 people). But the next year saw the beginning of remarkable in-migration from other provinces: 16,600 in 1987; 25,800 in 1988; 35,700 in 1989; 40,100 in 1990; and 34,600 in 1991.
The waves of inter-provincial in-migration to B.C. continued after the New Democrats had replaced the Socreds in Victoria: 39,600 in 1992; 37,600 in 1993; 34,500 in 1994; 23,400 in 1995; and 17,500 in 1996. (Source: B.C. Stats for 1971-1990, here -- and for 1990-2008, here)
Then, after B.C. had recorded a net gain of more than 300,000 Canadians in the space of a single decade, the tidal wave of inter-provincial in-migration finally ebbed. In fact, as other provincial economies rebounded from the downturn of the early '90s, it briefly went into reverse. Between 1998 and 2002, B.C.'s net inter-provincial loss was about 56,000.
And yet, despite the net out-flow of inter-provincial migrants, B.C.'s economy continued to show positive growth. How is that so?
In part the answer is international in-migration. From 1987 until 1997, B.C. had a net gain of 675,000 international immigrants -- an average of more than 61,000 per year. The number dipped to 6,900 in 1998, but then quickly resumed its upward trajectory. (Interestingly, although housing starts in the province fell from more than 29,000 to just 14,400 between 1997 and 2000, non-residential building permits remained steady and over-all capital investment held at about $20 billion annually.)
Still, the public perceived that the NDP government had mismanaged the B.C. economy (as well as the province's finances) and in May 2001 the New Democrats were soundly defeated by Campbell's Liberals.
THE EARLY 2000s AND THE BC LIBERALS
A striking feature of the chart above shows that both the New Democrats in 1991 and the BC Liberals in 2001 "inherited" a relatively weak provincial economy when they first took office. Yet it's difficult to blame either of their predecessors -- Social Credit in the first instance; the NDP in the second -- for the circumstance.
That's because in 1991, as both the Canadian and American economies fell into a deep recession, B.C. maintained weak, but positive economic growth. When the New Democrats were sworn into office in November 1991, the province arguably had already started its recovery, albeit from a very low point.
And in 2000, the New Democrats' last full year in office, B.C. recorded economic growth of 4.6 per cent. By the time Gordon Campbell's BC Liberals took the reins of government in May 2001, the U.S. was in the early stages of a recession, and then on September 11, terrorist attacks in New York City, Pennsylvania and Washington, D.C. rocked an already shaky American economy. The economies of Canada and B.C. also weakened, but remained in positive territory and rebounded in 2002.
Riding the global commodity boom
Unexpectedly, the BC Liberal government became the beneficiary of one of the most remarkable commodity booms in world history. The two-decade-long decline in real commodity prices ended suddenly in 2001, and global demand for energy, base metals and agricultural products shot skyward. B.C.'s economy, after trailing Canada's from 1997 to 2001, once again out-performed that of the nation as a whole.
Yet, in historic terms, B.C.'s economic growth remained relatively modest -- the best years under Campbell's Liberals, 2005 and 2006, had growth of 4.4 per cent. That's about equal to the NDP's best years (in 1993 and 2000), but well under the Socreds' highs of five and six percent (in 1985, 1987 and 1988).
Why didn't B.C. do better? Probably the biggest reason is that the forest-products sector -- our province's largest industry -- did not fully participate in the global commodity boom. Forestry and logging jobs, for example, fell from 36,000 to 24,000 between 2000 and 2007, while wood-products and paper-manufacturing employment slipped from 64,000 to 60,000 over the same period.
Moreover, while inter-provincial in-migration turned positive again from 2003 to 2008, the average was just 7,500 per year, a mere fraction of the numbers recorded after Expo '86. Housing starts in our province have recovered from their lows of the late 1990s, but in the mid-30,000s annually, remain well short of the 40,000-plus homes built in 1981, 1992 and 1993.
And, as last occurred a quarter-century ago in the early 1980s, B.C. in 2009 has followed the U.S. and Canada into a severe economic contraction. Its depth and duration are, at the present time, unknown.
Growth was biggest under NDP
So, is Carole James correct to blame Gordon Campbell for the loss of tens of thousands of jobs? It's a heckuva stretch. After all, the current global downturn has caused millions of jobs across the industrialized world to be lost. And, as the chart above illustrates, B.C.'s economy largely adheres to that of Canada as a whole.
Is Gordon Campbell right when he says that NDP economic policies failed B.C. in the 1990s? Hardly. In terms of GDP growth, the province out-performed the nation in three years, and trailed in six others, but every year recorded positive, albeit modest, increases.
And, finally -- it seems to be a big issue for some Tyee readers -- let's compare GDP growth over the last three decades. Under the Social Credit government, B.C.'s economy expanded from 1982 to 1991 by an average of 1.9 per cent annually. (The low number is largely a result of 1982's devastating decline of 6.1 per cent.)
From 1992 through to 2000, during the New Democrats' nine full years in power (which excludes the last two months of 1991, and the first four months of 2001), B.C.'s GDP grew by an annual average of three per cent.
Under Gordon Campbell's BC Liberals, provincial GDP from 2001 through 2008 rose by an annual average of 2.8 per cent. However, if we include the Royal Bank's estimates for 2009 and 2010, that number slips to 2.4 per cent.
Related Tyee stories:
- Campbell Misled Public on NDP Finances
In 2001 the incoming premier called NDP finances "worse than we anticipated." His briefing binders, gained by The Tyee through an FOI, told him the opposite. - Gordon Campbell, Financial Genius?
Lib rollercoaster ride ends up where it started. - The Fluke that Made BC Boom
Historic surge in commodity prices enriches. BC Libs take credit.
Read more: Politics, BC Votes '09: Your Issues, Labour + Industry


Tyee Commenting Guidelines
Comments that violate guidelines risk being deleted, and violations may result in a temporary or permanent user ban. Maintain the spirit of good conversation to stay in the discussion.
*Please note The Tyee is not a forum for spreading misinformation about COVID-19, denying its existence or minimizing its risk to public health.
Do:
Do not: