


Is it possible to explain B.C.'s health-care spending in a way that any one -- even, say, a political columnist in distant Ontario -- would understand?
Let's try to do so with a simple allegory.
A father sits at the dinner table with his family. He looks around the table with pride at his wife, teenage son and teenage daughter. He loves his family, but there is this one nagging thought...
Until recently, the evening repast had five participants. But a few weeks ago the eldest daughter left to attend university in another city. Rather than five people seated at the dinner table, there now are just four.
The meal starts to get underway when the father suddenly puts down his knife and fork, and exclaims: "Stop! We're all eating too much!"
His wife and progeny coolly look at him and keep eating. The daughter manages a one word reply between bites: "Explain."
"Well," says the father, "when there were five of us, each of us ate one-fifth of the total. But now, with just four, our individual consumption has soared to one-fourth, or one-quarter, apiece."
He continued, excitedly: "We've gone from each of us eating 20 per cent of the total food budget, to each consuming 25 per cent. This clearly is an unsustainable increase. We must be eating too much!"
Okay, the above scenario is farfetched and silly. But it also is the argument made by those -- such as B.C. Liberal politicians, certain members of the legislative press gallery and a prominent eastern journalist -- who argue that B.C.'s health-care spending is out of control.
Most Tyee readers -- sensible folk, that is -- would calculate that the family's food consumption, based on four people rather than five, probably has declined in total. Fewer people consuming less food at a lower total cost.
That there has been a percentage increase in one individual's consumption is an irrelevant consideration in comparison to that of the total meal size; that is, everybody's consumption, combined, and the total cost.
Debt, pass the potatoes to Transportation
Let us try the family dinner table again, but with a slight variation: the names of the family members correspond to those of provincial-government expenditures.
The father's name is Finance, and his wife is Social Services. Their eldest daughter (who actually hasn't gone to university, but is attending a nearby college and wants to become a mechanic) is called Interest on the Debt and their son is Transportation. The youngest daughter is Health.
Finance is convinced that all five family members are eating too much and ought to go on a diet. (In fact, he needs to cut the food budget because he wants to divert a sizeable part of the family income to an uncle, called Business. But that's a different story.)
After much discussion, he convinces Social Services, Interest on the Debt and Transportation to join him in reducing their caloric intake by one-quarter apiece. So, where each used to eat 20 per cent of the total dinner -- one-fifth for each of five people -- they now consume just 15 per cent per person.
Health, however, has refused Finance's entreaties -- she's playing girls' rugby at school and wants to keep her weight up (and, besides, she's a teenager and pretty much refuses to do anything her parents ask her to do) -- and continues to eat her typical, average dinner: no more, and no less.
This angers Finance. According to his calculations, the four family members who have cut back their consumption now eat just 60 per cent of the total dinner (four people multiplied by 15 per cent each), whereas previously it was 80 per cent (four times 20 per cent).
But Health, who used to consume 20 per cent -- one-fifth -- of the total (the same as her parents and siblings), now, because of their dieting, has seen her portion of the family meal climb to 40 per cent.
Health, of course, hasn't changed her dietary consumption at all; she's consuming no more, and no less, of the evening dinner than before. Yet, as the others' share of the meal decreased, Health's portion of the meal doubled.
It's simple. Because Finance, Social Services, Interest on the Debt and Transportation are consuming less, Health's consumption -- which is unchanged -- appears to have skyrocketed out of control, when really it hasn't changed at all.
Cutting indiscriminately
What does any of this have to do with B.C. politics and government spending on Health?
Well, consider that way back in 2002, Gordon Campbell's BC Liberals found themselves facing a gargantuan deficit. (Something to do with massive tax cuts, perhaps?) In response (or, perhaps it was their plan all along), the Campbell Liberals decided to cut government spending in all departments -- save Health and Education.
Here is what the Campbell government said in its Throne Speech on Feb. 12, 2002: "Over the next three years all ministries, not including Health and Education, will experience an average reduction of 25 per cent in their budgets."
And, this is what Gary Collins, then-finance minister, said one week later in his 2002/03 budget speech: "Total spending in ministries, except for health and education, is being reduced by an average of 25 per cent. That's a total of $1.9 billion over three years."
In other words, Health and Education were allowed to keep on consuming -- tax dollars, in this case -- at a similar rate as previously, but all other departments were to see their eating trimmed by one-quarter.
Golly, do you think that the portion of the budget allocated to Health and Education might have increased as a result of that policy decision? Of course you do. If you've got as far as Grade 10 in math and don't work in the news media, that is.
As a consequence of the Campbell Liberals' deliberate decision to cut or freeze spending in all government departments save Health and Education, the portion of the budget allocated to those two specific areas increased as a percentage of the total!
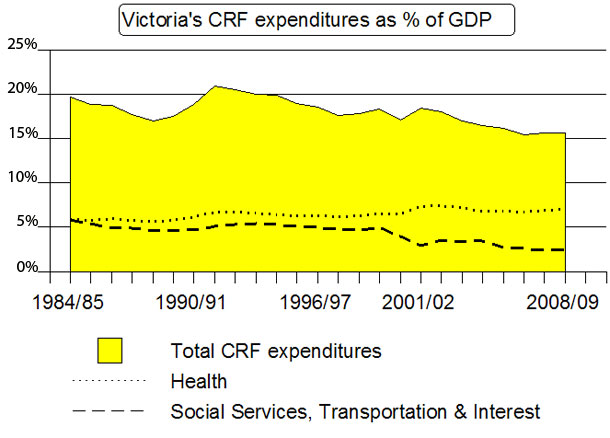
Moreover, the Campbell Liberals have continued since 2002 to dampen spending in all areas of government, including Health and Education. As the chart at the top of this column illustrates, the proportion of B.C.'s annual gross domestic product (GDP) allocated to the provincial government's Consolidated Revenue Fund (CRF), actually has been in free-fall for the past two decades.
In 1991/92, CRF spending peaked at 20.9 per cent of GDP, and in 2001/02 (when Gordon Campbell and the BC Liberals were elected to government) CRF expenditures were down to 18.3 per cent.
In 2008/09, the comparable figure was a mere 15.7 per cent. (See Table A3.6 on p. 107 here.) Over the last two decades, in other words, Victoria's spending as a proportion of the provincial economy has fallen by about one quarter.
Rising inflation, more people
The issue of Health's proportion of provincial expenditures is somewhat complicated by a pair of factors: inflation and population growth.
From 2002 to 2008, for example, the B.C. Consumer Price Index rose by an annual average of about two per cent. That is, with B.C.'s base CPI calculated at 100 for 2002, it was at 112.3 by 2008. (See p. 11, here.)
Also consider that in 2001, when Gordon Campbell became premier, British Columbia's population was 4,076,264. Last year, according to BC Stats, it was 4,455,207. That's an increase of nearly 379,000 -- or 9.3 per cent.
Is it surprising that government expenditures also have grown over time? So, where CRF spending was $22.4 billion in 2001/02 (the year before the BC Liberals won power), this year's budget saw CRF outlays hit $33.8 billion.
But, again, as a proportion of the provincial economy, CRF spending actually has declined over that same time period.
Health expenditures, too, have increased in concert with inflation and population growth. In 2001/02, Health outlays from the consolidated revenue fund totaled $9.7 billion; in the latest budget, the comparable number is about $14.8 billion.
As a proportion of GDP, however, they're virtually static.
Back to the table, everyone
Let’s look briefly at the table above, which shows provincial-government expenditures (CRF) as a proportion of B.C.'s GDP over the last quarter-century. (The data are from Table A3.5 on p. 106 here.)
The top line represents CRF expenditures. As mentioned earlier, they've been falling for the better part of the last two decades. (In fact, Victoria's spending as a proportion of the provincial economy today is almost as low as it was when W.A.C. Bennett left office in 1972.)
The second or middle line is Health spending from the CRF. It is amazing -- even more so given the near-hysterical proclamations by B.C. Liberal politicians and various members of the news media -- how static it has been over the last quarter-century.
In 2001/02, when Gordon Campbell became premier in 2001/02, Health outlays were 7.3 per cent of GDP. They had fallen by 2006/07 to just 6.7 per cent -- even as the Campbell government vowed to protect Health -- and in 2008/09 were recorded at an even 7.0 per cent of GDP.
The third line combines three areas of spending from the CRF: Social Services, Transportation and Interest on the province's debt.
In 1984/85, when Bill Bennett's Social Credit party was in government, Social Services expenditures totaled 2.5 per cent of GDP, Transportation also was 2.5 per cent, and Interest, 0.9 per cent.
Combined, these outlays represented 5.9 per cent of GDP. Interestingly, that is exactly the proportion of GDP that Health spending represented that same year. Indeed, the chart above shows that Health outlays in 1984/85 were identical to the combined expenditures on Social Sevices, Transportation and Interest.
All in relation to GDP
But look at what has happened over the last quarter-century. While Health has shown little change as a proportion of GDP -- the lowest level was 5.7 per cent in 1988/89, and the highest 7.4 per cent in 2002/03 -- the other three areas of government spending have fallen dramatically.
Social Services outlays were 2.5 per cent in both 1984/85 and 2001/02. Under the BC Liberals, however, Social Services expenditures dropped to just 1.6 per cent of GDP in 2008/09.
The provincial government, of course, does not directly control the interest rate that it pays on its debt. But governments around the world have benefited over the last three decades from declining low interest rates -- see here for a look at the yield on U.S. treasuries -- and the B.C. government is no different.
In 1984/85, CRF spending on the provincial debt represented 0.9 per cent of GDP. It peaked in the mid-1990s at 1.6 per cent, but by 2008/09 was down to 0.6 per cent.
Combined, these three areas of expenditure have fallen from 5.9 per cent of GDP a quarter-century ago, to an even 5.0 per cent when Gordon Campbell and the BC Liberals won election to government in 2001/02. Since then, they've collapsed even further to just 2.6 per cent in 2008/09.
Remember, Health and these three combined areas of expenditures were an identical 5.9 per cent of GDP a quarter-century ago. Today, however, Health outlays are about two-and-a-half times as great as the other three. Is that because Health spending has exploded, or because expenditures on the other three have swooned?
The big cutback
Two points to note in the chart above. First, it is evident that the dramatic decline in outlays in Social Services, Transportation and Interest on the Debt mirrors the on-going drop in overall government expenditures.
It's simple: as Victoria has cut back its total spending (as a percentage of GDP), certain areas of expenditure, perforce, have experienced significant declines.
Second, because every other area of government spending has fallen in recent years, Health -- where spending has been virtually unchanged over the past several decades -- has increased in comparison.
Between 1984/85 and 2001/02, Health's share of CRF spending grew from 30.2 to 39.5 per cent. By 2008/09, it was up to 44.8 per cent.
Think again of our fictitious family eating dinner: all of the people seated around the table have gone on a diet, and the family's food bill has declined as a proportion of their total income. But one family member, Health, continues to consume an amount not dissimilar to that which she ate before the diet was adopted. Compared to the others her consumption has grown as a proportion of the total, when, in fact, it is virtually unchanged.
It should be obvious -- even to an eastern journalist -- that Health spending in B.C. is not out of control.
Did Jeffrey Simpson miss math class?
Okay, let's name names. Jeffrey Simpson, political columnist with Toronto's Globe and Mail newspaper, seems in recent years to have been on a personal crusade against health-care spending. That's okay, except when he manufactures a false picture of British Columbia's fiscal situation and disseminates that nonsense to the rest of Canada.
Here's what Simpson wrote three months ago, on March 13. "B.C., like other provinces, is desperately raiding every piggy bank to pour revenue into health care."
He went on to call Gordon Campbell "brave" for attempting to slash health outlays, but also admitted that "even he [Campbell] can't rein in the costs inherent in the existing system."
Simpson continued in a similar, nonsensical vein two weeks ago, on May 29. "While B.C.'s health-care budget jumps by over $2-billion over three years, what about other spending?"
He then listed other areas of government expenditure that are in decline -- because, he says, Health spending, in real terms, is rising. In Simpson's world, Health is a voracious monster that eats the budgets of every other area of government administration.
In fact, in B.C. reductions in spending on non-Health areas are the result of deliberate policy decisions made by the government in power. It wasn't Health that made Victoria cut CRF spending from 20.9 per cent of GDP to just 15.7 per cent; it was successive administrations that wanted a smaller government.
As a proportion of B.C.'s economy, health-care expenditures in the last several decades have been virtually static. Only in comparison to the falling budgets of other areas of spending do Health costs appear to be rising.
So, far from being out of control, Health in B.C. merely has refused to go on the same diet imposed on the rest of Victoria's annual outlays. It is a concept that a teenage, rugby-playing girl could understand, but one that evidently eludes an Eastern political columnist. ![]()


Tyee Commenting Guidelines
Comments that violate guidelines risk being deleted, and violations may result in a temporary or permanent user ban. Maintain the spirit of good conversation to stay in the discussion.
*Please note The Tyee is not a forum for spreading misinformation about COVID-19, denying its existence or minimizing its risk to public health.
Do:
Do not: