

The long-awaited release of 2011 National Household Survey data garnered headlines earlier this month by hinting Vancouver is not actually doing all that terribly on homeownership and affordable living.
To the bafflement of some observers, the city seemed scarcely behind the rest of the country in the number of us owning our own homes. It also apparently came close in affordability to Montreal and Toronto (our sibling cities in the planner-nicknamed "MTV" trio).
The data seemed a bit comforting. More than 65 per cent of Vancouverites now own their own homes. Just over one-third of households spend more than 30 per cent of their income on lodgings, the official definition of "unaffordable"; on that count it seems we're doing better than the rest of the MTV by a couple points.
So much for the outcry that Vancouver is the "most unaffordable city" in North America.
Right? Well, maybe not so fast.
Spend a little more time swimming in the government's vast data stream -- wading through agglomerations, divisions, subdivisions, tracts and districts (six hours of which induces a distinct sense of info-suffocation) -- and questions begin to swirl in eddies.
Among the first things you learn is that to Statistics Canada, most data about Vancouver actually refer to the Census Metropolitan Area (CMA), encompassing everything from West Vancouver to Langley and all the way down to White Rock.
When you zoom in on the actual City of Vancouver itself, the numbers are less surprising: The majority of us (51.5 per cent) are indeed renters. The only major Canadian city with fewer homeowners per capita is Montreal -- and the average rent there is massively more affordable. Tenants here fork over an average of $1,089 in rent every month, almost 50 per cent more than the fortunate renters of la belle ville.
In Vancouver, nearly half of us (46 per cent) are paying more for lodging than we can afford, at least according to the official definition. But some analysts warn that even these numbers could be understating the problem.
The National Housing Survey provides the first nation-wide, official data to emerge since Prime Minister Stephen Harper axed the mandatory long-form census in Aug. 2010, to the chagrin of statisticians.
And as with many things, the devil's in the details. A closer look at the numbers reveals much about the state of today's housing crisis in B.C. But it also raises the worrisome question of how political leaders can make vital policy decisions with less accurate data than ever before.
'Not representative'
The demise of the long-form census continues to vex planners, policy wonks and researchers three years after its forced retirement.
"The housing questions themselves are pretty much the same as they were on the long-form census," explained Jerry Situ, senior housing analyst with Statistics Canada, of the National Housing Survey. "But now it's a voluntary survey.
"Definitely the methodology is different from a mandatory survey to a voluntary survey. With the topic of housing, when we look at things like affordability, it does become more difficult."
In the absence of margins of error from random sampling and required responses, Statistics Canada had to invent a new indicator to reflect their incomplete data: the Global Non-Response Rate.
It blends the overall percentage of no-shows with partially completed answers. Across the country, it was roughly one-quarter of all recipients of the National Housing Survey, despite national advertising and selective nagging.
"In addition to media campaigns to encourage Canadians to answer the survey, if a household was selected for the survey and they did not answer, there were several follow-ups," he explained. "The follow-up was very targeted to focus on where there were large differences in characteristics, where we needed responses."
For critics, however, the elimination of the mandatory long-form survey dealt an insurmountable blow to accurate data collection.
"The Conservatives have changed the way we do statistics in Canada," says Sean Antrim, executive director of the Coalition of Progressive Electors. "I have the utmost faith in the staff at StatsCan, but I have no faith in their leadership."
Among the consequences that could have affected the results, suggests planner and researcher Andy Yan, is the roughly one-quarter of City of Vancouver respondents who didn't bother filling out the voluntary survey.
"It's a pretty substantial non-response rate," said the researcher. "There are also questions about whether people have honestly responded."
Yan, senior urban planner at Bing Thom Architects, speculates that among those significantly overlooked in the new survey's data are poorer communities and those who don't speak English -- many of whom rely on services that governments provide based on the very demographic statistics that may now be failing to include them.
"There's an issue with certain communities being undercounted, like the renter community and those under-housed," Yan said. "It would not be surprising if they were lower-income, with English or French not their primary language. Arguably that would affect the results of the National Household Survey."
Even Statistics Canada admits that missing responses pose "a substantial risk of non-response bias," according to its website, and that therefore "the results are not representative of the true population."
Could the voluntary aspect of the National Housing Survey mean that certain sectors of the population are systematically less likely to fill it out than others, thus biasing the results?
One individual who thinks so is architect Michael Geller. "This is based on the people who filled out the new census," Geller says. "There's a very large number of illegal basement suites in Metro Vancouver," he offered as an example. "[They] may well not be responding to such questionnaires.
"They may not have gotten them, or they may be reluctant to fill them out when they know the suite they're in may be illegal."
'Dream' homes just that
But even in its shortcomings, the survey offers some curious revelations.
StatsCan's Situ said the Metro Vancouver data show that home ownership levels are decelerating after decades of steady rise. "In Vancouver, we still see that homeownership rate is increasing, but at a much slower rate than in the past."
And a clear lesson from the survey's first detailed look at condominiums, he added, is that whether owned or rented, condos are becoming a central source of housing here.
"We now have almost a complete picture of condominiums. In Vancouver, in terms of new constructions, condominiums are now playing a very large role in terms of housing," Situ said.
Comparing Vancouver's neighbouring cities also offers some curiosities.
Those most likely to skip filling out their optional housing survey form were the wealthy of West Vancouver, with nearly a 28 per cent non-response rate. Surrey and New Westminster tied for second-highest non-response rate, at 26.5 per cent.
Richmond residents participated in the survey with most gusto: four out of five recipients filled out and returned their forms.
When it came to the subject of the exercise, Burnaby revealed higher levels of home-ownership than Vancouver, at 63.5 per cent, but still lagged behind Calgary (72.4) and Ottawa (67.3).
Within the Metro region, the highest rate of home ownership appeared to be in survey-shy West Van, with only two of five households renting. As one might expect, the North Shore community also has by far the most expensive monthly housing costs, at $1,787 on average.
For COPE's Antrim, Vancouver's majority-renter population reflects the collapse of the "ideal" late-20th century life trajectory -- get a job, move up the work ladder, save for a down payment and buy a house that becomes a nest egg for your future.
"The focus on home ownership is still built on that dream," he argues. "[But] I know very few people who can afford to buy a home. Even those I know who own can't even afford to maintain their homes. Most renters are just struggling to pay their rent, let alone dreaming of buying a home.
In those circumstances, Antrim considers the preoccupation with home ownership a distraction from deeper issues. "We're the most unaffordable city in North America for a reason," Antrim says. "On the ground for renters, it's not getting better."
If Vancouver is to truly be liveable, he argues, poorer renters' concerns need to be heard and addressed.
"I see a huge potential there," he says. "But you have to ask the people affected how to solve them... If we started building a movement to talk to the people most affected by the crisis, and listening to their voices, we'd start moving in the direction of finding solutions to these problems."
But whether attainable or not, the dream of home ownership hasn't died by any means. "The fact that housing is very expensive in Vancouver doesn't mean people don't become owner-occupiers," says Tsur Somerville, at UBC's Sauder School of Business. "But it does mean that they do so at higher price, for less unit, than somewhere else.
"Condominiums reflect a reality that people are keen to enter homeownership, even if they don't have the resources to buy a house. Part of that is they see it as a path to eventually owning a house."
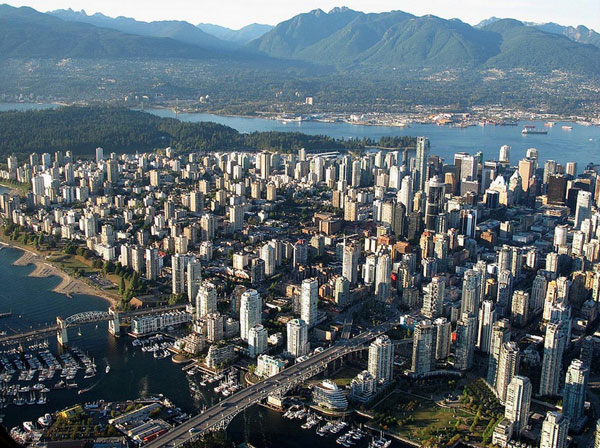
By sea, by land, by air we prosper
The contrast between home ownership rates and housing affordability in Vancouver and its surrounding municipalities should put a spotlight on one of the tensions currently simmering at city hall. They reflect a fact of geography not all Vancouverites seem ready to acknowledge.
Surrounded on all sides by sea and other municipalities, Vancouver proper has nowhere to expand -- to build the new units that might tip the supply-demand equation toward lower prices -- but up. And that will only happen if its residents accept greater housing density.
But while many people complain about Vancouver's expensive housing, to just as many "density is a bad word," notes Anne Mullin, president & CEO of the Urban Development Institute (UDI), which represents Canadian developers. "But it's an important discussion to have."
She's alluding to neighbourhood uprisings that have blossomed across Vancouver against city hall's efforts to boost density. Marpole residents, for instance, blocked a "thin streets" proposal to allow more houses per lot. Grandview-Woodland neighbours became incensed at the idea of high-rise towers being added to the bustling transit hub at Commercial and Broadway.
"Vancouver land prices are high," Mullin says, "but if we provided more of a diversity of housing, there'd be more opportunities."
As for the National Household Survey's admitted weakness, urban planning researcher Andy Yan hopes the federal government will consider better public engagement and follow-up, to get the non-response rates down from their current heights.
That would at least make sure civic decision-makers have all the facts before they lock in -- or out -- developments that will influence housing availability and cost in Vancouver for decades. ![]()
Read more: Housing, Urban Planning + Architecture


Tyee Commenting Guidelines
Comments that violate guidelines risk being deleted, and violations may result in a temporary or permanent user ban. Maintain the spirit of good conversation to stay in the discussion.
*Please note The Tyee is not a forum for spreading misinformation about COVID-19, denying its existence or minimizing its risk to public health.
Do:
Do not: