


As the B.C. New Democratic Party racks its neural tissues to discover how it blew a 20-point lead in the polls on May 14, it might be happy to learn that the news isn't all bad.
Sure, the NDP was thumped in an election that everybody expected it to win. But it did make gains in some unexpected places.
Among the very rich, for example.
Final election results show the NDP made some of its biggest gains in some of B.C.'s wealthiest ridings. Ridings like Vancouver-False Creek, where the NDP increased its total by a healthy 3,479 votes over its 2009 showing. Ditto for Vancouver-Fairview (up 2,768 votes) and North Vancouver-Seymour (up 2,343 votes).
All three of those ridings are among the 10 constituencies with the highest median after-tax incomes, according to BC Stats. In fact, six of the 10 ridings where the NDP made its biggest gains May 14 are on that top 10 income list. (The figures, while the latest available for income by constituency, come from the 2006 census and are a bit dated. But heck, a riding that was wealthy in 2006 is probably still doing pretty well today.)
The table below shows the wealthy ridings where the NDP vote increased the most. The margin columns show who won the riding in the last two elections and the winner's margin as a percentage of the total vote.
| Riding | 2009 Margin | 2013 Margin |
|---|---|---|
| Vancouver-False Creek | Lib 28.9 | Lib 15.5 |
| Vancouver-Fairview | Lib 4.9 | NDP 5.1 |
| North Vancouver-Seymour | Lib 31.8 | Lib 18.0 |
| Vancouver-Point Grey | Lib 10.1 | NDP 4.4 |
| Surrey-Cloverdale | Lib 32.9 | Lib 30.5 |
| West Vancouver-Capilano | Lib 53.0 | Lib 44.7 |
As shown, two of these wealthy ridings, Vancouver-Fairview and Vancouver-Point Grey, abandoned the Liberals for the NDP. And the Liberals' victory margins fell in all of the other four. Clearly, in B.C. the class war is riddled with quislings.
As the NDP pores over its election flop, there is an obvious message in these numbers: it is time for the NDP to go after the crème de la crème. For whatever reason, British Columbia's plutocrats are starting to take a shine to the left. New Democrats would be fools to rebuff them.
No big electoral shifts
It's true that marketing the NDP to the one per cent would present some challenges. The party grassroots would be sure to cause a fuss, and making gains among the economic elite would require a long-term strategy.
Most of the ridings on the table above still boast pretty fat Liberal margins. If the trend from May 14 continues, the NDP won't capture West Vancouver-Capilano, for example, until the election of 2037.
Still, that kind of long-range thinking might be what's needed to succeed in B.C. politics. As the graph below shows, things haven't changed much lately.
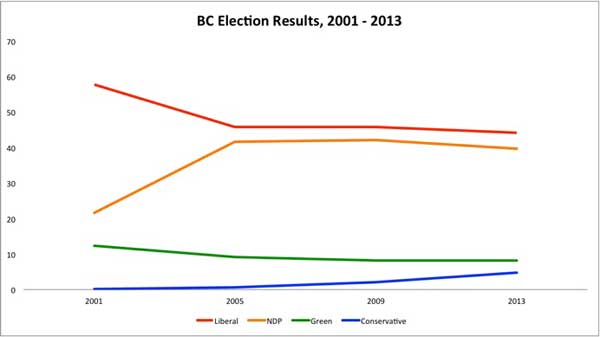
Ever since British Columbians recovered from the 2001 Liberal landslide, all the scandals and fevered rhetoric that B.C. politics is famous for have produced bupkis in terms of big electoral shifts.
Even the one bit of movement that shows up on the chart -- the uptick in the Conservative vote -- is misleading. The Conservatives ran 24 candidates in 2009. They ran 56 official candidates in 2013, plus another four candidates who weren't listed as Conservatives on the ballot because of a paperwork snafu.
So, while the party's overall share of the vote went up on May 14, its vote per candidate didn't do much. In 2009, the Conservatives got 1,435 votes per candidate. In 2013, they got 1,532 votes per official candidate -- 1,483 votes per candidate if you include the four "unofficial" Tories.
On the other hand, the other third party, the Greens, saw their share of the total vote stay flat at just over eight per cent. But that masks a remarkable increase.
In 2009, the Greens ran a full slate of 85 candidates. This year, they ran only 61 candidates. The Green vote per candidate jumped to 2,403 from 1,584 -- an increase of 52 per cent.
The Green vote more than doubled in seven ridings, all but one of them in southern Vancouver Island.
And, if you're wondering, while the Greens won their only seat in wealthy Oak Bay-Gordon Head, they didn't make any real gains in the other most-affluent ridings.
Which still leaves the champagne-slurping fat-cat vote wide open for the NDP to exploit. ![]()
Read more: BC Politics, BC Election 2013


Tyee Commenting Guidelines
Comments that violate guidelines risk being deleted, and violations may result in a temporary or permanent user ban. Maintain the spirit of good conversation to stay in the discussion.
*Please note The Tyee is not a forum for spreading misinformation about COVID-19, denying its existence or minimizing its risk to public health.
Do:
Do not: