


How do British Columbia’s key indicators for sustainability stack up against states in the United States that share some similarities in ecologies and economies?
The Seattle-based think tank Northwest Environment Watch issues a Cascadia Scorecard every year tracking seven trends.
In 2005 BC led the region in lifespan, but, saw its economic security indicators decline for the third straight year. And, as reported yesterday, British Columbians are heavily dependent on an energy supply that slows the economy, contributes to global warming, and is vulnerable to sabotage.
The comparisons:
Health: Residents of BC, who live to 80.9 years on average, have the longest lifespan in the Pacific Northwest and in Canada. If BC were an independent nation, it would have the second longest life expectancy in the world, trailing only Japan (81.8 years). But lifespan in the province varies widely: residents of northwest BC and the province’s northern interior, for example, live only to about 78 years. Keys to improving health throughout BC include policy innovations that will improve access to medical care and reduce poverty.
Economy: The Scorecard’s economic security index, a more accurate gauge than GDP of how working families are faring, shows that 2002—the most recent year for which complete poverty and income data were available—was BC’s third consecutive year of declining economic security. The province’s child poverty rate (19.6 percent) reached its highest level since 1996.
Population: British Columbians have the smallest families in the Pacific Northwest (1.4 average lifetime births per woman), likely a result of poverty rates that are lower than the Northwest states’ and better access to reproductive health care and contraceptive services. Family size is a sensitive indicator of educational and economic opportunities for women, especially young or poor women.
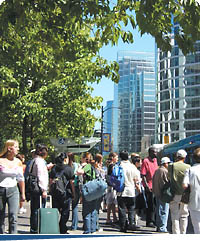
Sprawl: The Cascadia Scorecard’s sprawl study of seven cities in the Northwest shows that BC’s cities--Vancouver and Victoria—scored first and second, respectively, for smart growth. And a 2004 study of 15 US cities showed that greater Vancouver had a higher share of its residents in compact densities than any of the cities studied, due at least in part to its aggressive promotion of dense, walkable downtown development.
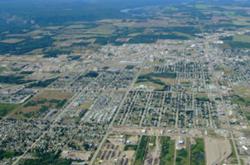
Forests: The Scorecard uses NASA satellite imagery to monitor five forested areas, two of which are in British Columbia: the Williams Lake region and the Inland Rainforest. From 1971-2002, BC clearcut a smaller share of its forests in the Scorecard study areas than either Washington or Oregon. But logging in BC is primarily in virgin timber, where the ecological consequences of logging are more serious.
Pollution: The Scorecard’s 2004 study of toxics in the bodies of northwesterners analyzed breastmillk samples from 40 mothers, including 10 in BC. The study found high levels of PBDEs—chemicals used as flame retardants in products such as furniture and computers—in every sample tested, at levels 20 to 40 times higher than those found in Europe. BC, and Canada, should consider following Washington state’s lead to ban PBDEs and promote safe alternatives.
Energy: Each British Columbian resident consumes the equivalent of 42 litres of gasoline in highway fuels and nonindustrial electricity a week—50 percent more than Germans (28 litres), but less than the Northwest states (61 litres). Overall, BC’s energy system is slowing the economy; contributing to climate change; and is vulnerable to sabotage. Luckily, there are solutions that can tighten security at a profit (see our related article).
Alan Durning is executive director of Northwest Environment Watch. The Cascadia Scorecard, launched in 2004, monitors seven key trends critical to the future of the Northwest, including health, economy, population, energy, sprawl, forests, and pollution. See sidebar, “Keeping Score,” for more information on the province performed in these trends. And for regular updates on the Scorecard, subscribe here. ![]()


Tyee Commenting Guidelines
Comments that violate guidelines risk being deleted, and violations may result in a temporary or permanent user ban. Maintain the spirit of good conversation to stay in the discussion.
*Please note The Tyee is not a forum for spreading misinformation about COVID-19, denying its existence or minimizing its risk to public health.
Do:
Do not: