The Liberals welcomed in the New Year by launching an attack ad against Adrian Dix. A similar stunt directed against BC Conservatives leader John Cummins was followed by a jump in the polls for the Conservatives. It will be interesting to see what polls show after the latest ads run for a few weeks.
Clark's newest negative ad makes selective use of statistics to misrepresent job growth, interprovincial migration, provincial taxes and NDP promises. In order to be effective, negative ads need to be rooted in some verifiable facts. Not only can nothing be verified in Clark's ads, but the claims can be shown to be false. They are reviewed and exposed below.
False claim 1. Dix was top advisor to NDP premiers. It must be crushing for the egos of Moe Sihota, Joy MacPhail, Doug McArthur and Tom Gunton to see Premier Clark's latest negative ad describe Adrian Dix as "chief political advisor" of the 1990s. Of course the reason for that attribution by Clark and her Liberal team is to associate Dix with their negative characterization of the '90s, to focus political discussion two decades ago and to avoid accountability for their record of lost trust.
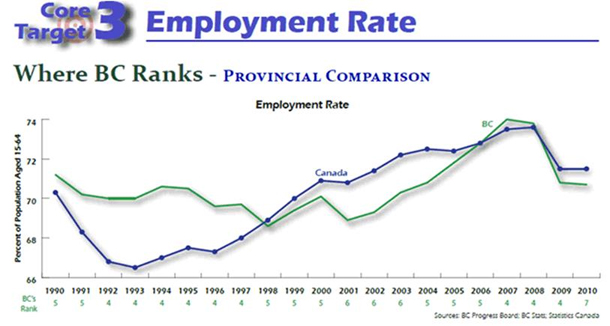
False claim 2. BC under NDP 'dead last' in job growth according to Progress Board. Clark's negative ad cites the 2001 BC Progress Board report for its claim that B.C. was "dead last" in job growth; however, you can't find those words in that report. The ad misused the 2001 report's comment on the rate of change in the job to population ratio. Statistics Canada annual Labour Force Survey data show B.C. employment of 1.5775 million in 1991, 1.9197 million in 2001 and 2.2565 million in 2010. That means average annual compound job growth was 2.0 per cent from 1991 to 2001 and 1.8 per cent from 2001 to 2010. B.C. experienced lower job growth in 2011.
One of Clark's first actions was to eliminate the Progress Board. Its 2011 report showed B.C. to be in better shape in 2000 than in 2010; as shown in the table reproduced from the report, B.C. had a better ranking in every year from 1990 to 2009 than it did in 2010. The job to population ratio might not be as good an indicator as simple job growth because, as noted in the report, the ratio favours provinces with younger populations. A downward trend in the employment to population ratio may say more about changing demographics than it does about economic opportunities.

False claim 3. NDP policies caused mass exodus according to B.C. Stats. Clark's negative ad asserts that 50,000 people left B.C. for other provinces in search of work between 1998 and 2001 according to B.C. Stats provincial migration flow data. The actual data don't reveal why people come to or leave B.C., but they show tens of thousands flowing both ways in any given year. Sometimes more people arrive from other provinces than leave to those provinces and sometimes the net flow is opposite. The quarterly data show a net interprovincial outflow for the first three quarters of 2011 (data for the fourth quarter won't be available until March 2012). Those data also show net outflows from the fourth quarter of 1997 to the second quarter of 2003. From the fourth quarter of 1992 through the second quarter of 2001, B.C. had a net interprovincial inflow of 103,722. From the third quarter of 2001 through the third quarter of 2011, B.C. had just over half as much net inflow, only 55,256.
As one tweeter said: who cares? The answer lies in the Liberals' repeated misuse of these statistics; they must care because misrepresentation of interprovincial migration data has become part of their mantra. Interprovincial migration is one component of population change, and the truth is people move both in and out of B.C. all the time. B.C.'s population had an average annual growth rate of 2.2 per cent between 1991 and 2001 and 1.3 per cent between 2001 and 2010.
False claim 4. BC Liberals are big tax cutters for average families. Clark's negative ad speaks about income tax cuts for average families and says, "Dix wants to raise taxes again." The truth is the Liberals have shifted where they get government revenue. Personal income tax cuts have been substantially offset by increases in more regressive provincial taxes and fees; regressive taxes are those that decline as a proportion of income as income increases. For example, a family of four with a $60,000 income pays the same MSP premium tax as the same sized family with an income 10 times larger. In 2000 the MSP premium tax for a family of three or more was $864 per year; effective Jan. 1, 2012, the family MSP premium tax increased to $1,536 per year, an increase of 78 per cent since the Liberals came to power.
It is not just hikes in the MSP premium tax that have clawed back income tax cuts. In each budget the Ministry of Finance includes a table that compares federal and provincial taxes by province for various benchmark families, for example a two income family of four making $60,000 and a similar family making $90,000. Comparing those tables between the last budget tabled by NDP Finance Minister Paul Ramsey in early 2001 with the last budget tabled by Liberal Finance Minister Kevin Falcon in 2011 shows how much various provincial taxes increased since 2001.
The tables show the portion of the property tax that is set by the province so as to fund part of the education budget. For the $60,000 family between 2001 and 2010, the school property tax (net of the homeowner grant) increased by $128. The sales tax, provincial portion of the HST, increased by $458; the fuel tax by $53, and in 2011 that family had a carbon tax that it didn't have in 2001, costing it another $122. Those direct and indirect provincial tax hikes cost the Ministry of Finance's benchmark $60,000 family a total of $1,433. If that family uses BC Ferries it lost more, as it did from Hydro and ICBC increases.
The B.C. Progress Board's 2011 report indicated that in terms of real personal disposable income per person, B.C. ranked third amongst the provinces from 1991 through 2007, slipping to fourth from 2008 through 2010.
Clark's attack ad is particularly mischievous with its claim about Dix increasing taxes next to its claim about personal income taxes. Dix said he would return corporate taxes to their 2008 levels; the same change that Premier Clark once promised to make if voters agreed to keep the HST. Dix has also said that he would restore a minimum capital tax on banks. Interviewed on CKNW by Bill Good, Dix said he is reluctant to consider personal income tax increases. He said any tax changes would be disclosed before the May 14, 2013 election. In declaring his intent to increase corporate taxes by returning to the level enjoyed after seven years of Liberal government, he set out platform details 18 months ahead of the election. Early disclosure like that is unprecedented.
False claim 5. Dix is committed to 'billions in new spending.' Clark's negative ad concludes by accusing Dix of committing to "billions in new spending." They claim Dix is the source for that figure by citing a list of dates next to his name, but nowhere on either the website which features the negative ad or on the Liberal caucus or party websites can anyone find a list of promises that add up to and support their assertion.
The truth is that Dix is being moderate and driving down expectations. During his lengthy speech at the party's December convention, he referred to the financial challenges facing the province and how that meant an NDP government would have to limit what could be accomplished in a first term. He has repeatedly said that prior to the 2013 campaign he will lay out a list of commitments and how they will be financed. My advice is not to produce such a list until after the 2013 budget is tabled in the Legislature. That will be three months before the May 14th vote, allowing plenty of time for voters to compare the NDP's vision for 2013-17 with that of the Clark Liberals. ![]()
Read more: Politics


Tyee Commenting Guidelines
Comments that violate guidelines risk being deleted, and violations may result in a temporary or permanent user ban. Maintain the spirit of good conversation to stay in the discussion.
*Please note The Tyee is not a forum for spreading misinformation about COVID-19, denying its existence or minimizing its risk to public health.
Do:
Do not: