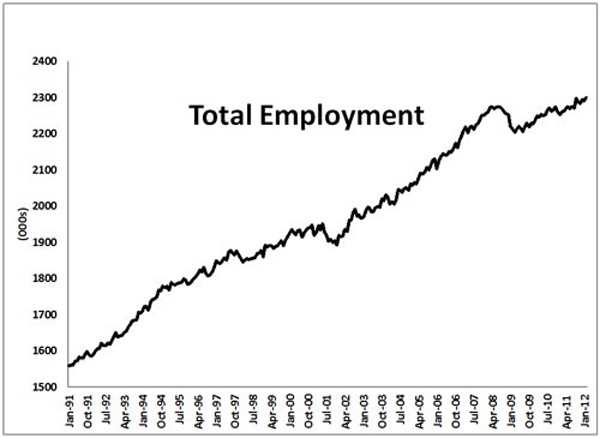
In February, Statistics Canada made access to most of its data free, eliminating the previous charge of $3 plus HST for every series. For example, if you wanted employment data for B.C. and Canada from 1980 through 2012, it would have cost $6.72; if you also wanted full-time employment data, the bill would have increased.
Complicated work involving interprovincial comparisons meant spending hundreds of dollars for data.
The change now makes it possible for anyone to fact-check many political claims. To demonstrate how easy it is to access and use this free data, a good start is to watch the five minute CANSIM tutorial.
Let's say you are interested in checking claims about job creation.
Clicking on the top level Statistics Canada website and scrolling down reveals a box with "latest indicators." Clicking on unemployment rate brings up the latest release of the Labour Force Survey (LFS). Scrolling down reveals a list of CANSIM tables for the LFS. It takes some digging, but going through the tables shows seasonally adjusted data in Table 282-0087.
From there, it is a matter of following the steps outlined in the CANSIM tutorial to select seasonally adjusted data for B.C. It is important to select data in small bites because clicking on "select all" produces too much data to easily download and handle.
The graph shown at the top of this article was created by selecting just B.C. as the province, total employment, both sexes, 15 years and over, seasonally adjusted, January 1991 through February 2012 and time as rows. After clicking "apply" and "download" the data are easily imported into a spreadsheet for creating the graph. Notice it shows growth for most of the past 22 years, with the exception of the 2001 and 2008-2009 recessions.
Most of what you hear about jobs in the 1990s compared to the last decade is political spin. You can also replicate the work of the BC Progress Board and see that relative to other provinces, B.C.'s job performance ranked fourth or fifth for most of the '90s, as it did for the last decade, although B.C.'s performance dropped to seventh in 2010.
Explore your inner geek
The challenging part of using CANSIM to do your own fact-checking is it takes some familiarity with the data. Journalist Andrew Coyne illustrated that point recently when he tweeted that the Statistics Canada website was difficult to use because he couldn't find quarterly GDP data for Ontario. Those familiar with the data were able to tell him provincial GDP data are only produced on an annual basis; one way of finding this data is to search CANSIM on the term "provincial economic accounts."
Coyne was searching for something that has never existed. Keep that in mind when you hear claims about B.C.'s economic performance. Many of the claims are impossible to verify, because there are no data. Knowing that is important because it allows those who make claims to be challenged. Now that access to the 43 million data series on CANSIM is free, when claims are made, ask for the CANSIM table number that can be used to fact-check.
[Tags: Politics.] ![]()
Read more: Politics


Tyee Commenting Guidelines
Comments that violate guidelines risk being deleted, and violations may result in a temporary or permanent user ban. Maintain the spirit of good conversation to stay in the discussion.
*Please note The Tyee is not a forum for spreading misinformation about COVID-19, denying its existence or minimizing its risk to public health.
Do:
Do not: