


As an economist who opposes the HST, I object to supporters of the HST frequently ridiculing opponents of the tax by portraying them as economic ignoramuses. A well-produced and funny 15-minute YouTube video dissects a paper released by Fight HST, the group headed by Bill Vander Zalm. The people who made B.C. history by being the first to successfully use the Recall and Initiative Act are not economists, but community activists who can see what the HST is costing families as a result of the $2 billion cost shift: businesses no longer pay PST and consumers pay tax on a much broader range of goods and services to more than make up the difference.
It is frequently claimed that most economists support value-added taxes like the HST. I don't know of any survey of economists to substantiate that claim, but I am aware that there are only a handful of economists who regularly speak out or write in favour of the tax. Two economists have attempted to quantify effects of the HST, Michael Smart for Atlantic Canada and Ontario and Jon Kesselman for B.C.*
The purpose of this column is to demonstrate that Kesselman's study is incorrect for two reasons. First, and most importantly, an analysis of the last 30 years of consumer price index (CPI) data show his results could be randomly obtained almost two thirds of the time. Second, the CPI data he used may be inadequate for the purposes for which he used it.
'Difference-in-Difference estimation'
Kesselman's paper was prepared for the Business Council of British Columbia. By email he informed me that a version of his paper, updated with the latest CPI data, will be published in the June issue of Canadian Public Policy. He argued that his analysis of the CPI: "... finds that the HST resulted in a 0.6 of one per cent increase in overall consumer prices in BC. This finding indicates that the average consumer is now paying just one additional dollar for every $165 of spending." He went on to write:
"Public skepticism on this point is widespread. Admittedly it is difficult for consumers to identify small price cuts across a vast array of goods and services -- whereas it is easy to see the HST, which is printed clearly on every sales receipt. But the different operation of the HST relative to the RST offers good reasons to expect the prices of some items to decrease post-HST. In this study I report on data that confirms that businesses have in fact passed through to consumers large amounts of their tax savings with the HST."
Kesselman's claims are based on a method known as Difference-in-Difference (DD) estimation. He looked at the increase in the consumer price index for all items excluding energy between June and July 2010. He then looked at the difference between the increase in the CPI for B.C. between July and December compared to the average increase in it for Alberta, Saskatchewan and Manitoba. From that relatively simple calculation he reported "price impacts for B.C. were 1.0 per cent in the first month and –0.5 per cent in the next five months, for a net impact of 0.6 per cent over the six-month period."
He then claimed that the 0.6 per cent represented the consumer impacts of harmonization and that low figure was consistent with forecasts that assumed full pass-through of the business tax savings. That conclusion is very strong for what amounts to an interpretation of one glorified ratio of index numbers, so I repeated Kesselman's calculations, not just for the last several months but for the last 30 years.
Unreliable calculation
The motivation for my look at the CPI since 1981 came from a study done by three economists at the Massachusetts Institute of Technology. They randomly generated placebo laws in state-level data on female wages and then used a regression to compute the DD estimate of the placebo's "effect." They found that the DD estimation resulted in an "effect" significant at the 5 per cent level for up to 45 per cent of the placebo laws.
Using the CPI data for all items excluding energy for B.C., Alberta, Saskatchewan and Manitoba, I repeated Kesselman's calculations for 30 years of data. I looked at the change between June and July 1981 and compared it to the difference between B.C. and the western province average between July and December 1981. That formula was generalized to other months so, for example, I calculated the change between January and February 1990 compared to the difference between B.C. and the western province average between February and July.
A graph of the figures that are equivalent to Kesselman's 0.6 per cent is shown here.
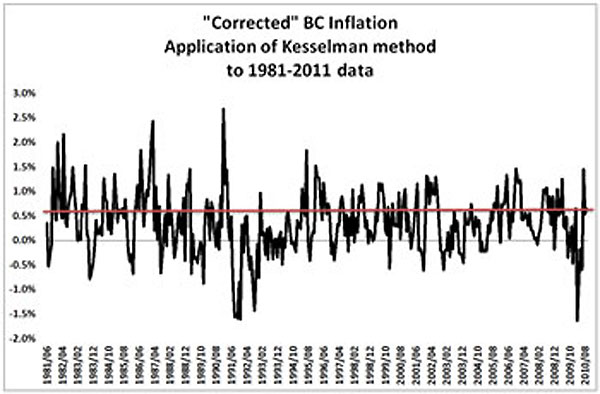
If a month is chosen at random, there is a chance of almost two out of three to get an estimate that our placebo change had an impact of less than 0.6 per cent (226 months produced calculations under 0.6 per cent and 126 produced calculations over 0.6 per cent).
Not only did Kesselman rely on an unreliable calculation, but he may have pushed the CPI beyond what it is designed to do. Documentation from Statistics Canada says: "Statistical reliability is inherently more difficult to assess for price indexes than for other statistical series due to the complex nature of composite price change and the statistical problems of estimating composite price change." It goes on to say: "Sampling error for the CPI price surveys is difficult to quantify because, except for rents and traveller accommodation, product and outlet samples are based on judgmental rather than probability sampling methods." The documentation concludes:
"The CPI is believed to be sufficiently accurate for most practical purposes. Accuracy is best at higher levels of geographic and product aggregation due to the larger sizes of the price samples for high levels of aggregation. As well, since errors can occur in price collection and editing or in making quality adjustments to estimate "pure price change", higher level aggregate indexes are likely to be better quality than lower level indexes because any distortions due to errors are more likely to cancel out. In general accuracy is better at the Canada level for any product index in the CPI compared to the same index at the province or city level. Also, accuracy is better at the All-items or major component levels of the CPI compared to individual product indexes. Finally, the CPI is more accurate as an indicator of change over several months or a year compared to the accuracy of the price change measured from any one month to the next."
Kesselman was correct when he observed public scepticism is widespread. I hope the argument I've made here demonstrates why the public has every right to be sceptical. I don't know if the talented UBC videographer will use this column to do a spoof of pro-HST economists, but one is warranted.
*Story updated at 11:10 a.m., May 25, 2011. ![]()
Read more: Politics, Labour + Industry


Tyee Commenting Guidelines
Comments that violate guidelines risk being deleted, and violations may result in a temporary or permanent user ban. Maintain the spirit of good conversation to stay in the discussion.
*Please note The Tyee is not a forum for spreading misinformation about COVID-19, denying its existence or minimizing its risk to public health.
Do:
Do not: