Christopher Pollon is an independent journalist, a contributing editor to The Tyee and a member of the Tyee Solutions/Housing Fix reporting team.
Christopher Cheung reports on affordable housing for the Housing Fix.
Chris Wood is Tyee Solutions Editor.
2016-17 funders of the Housing Fix are Vancity Credit Union, Catherine Donnelly Foundation and the Real Estate Foundation of B.C., in collaboration with Columbia Institute. Funders of special solutions reporting projects neither influence nor endorse the particular content of our reporting. Other publications wishing to publish this article or other Housing Fix articles, please contact editor Chris Wood here.]
68SHARES
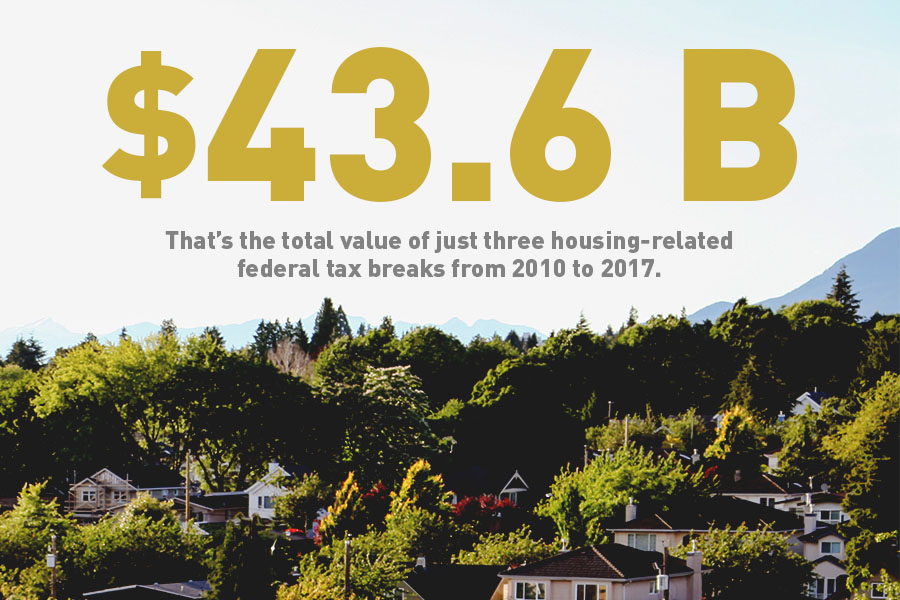
#1. Tax exemptions have left billions of dollars in homeowners’ pockets, contributing to a runaway advantage in wealth.
Source: Government of Canada.
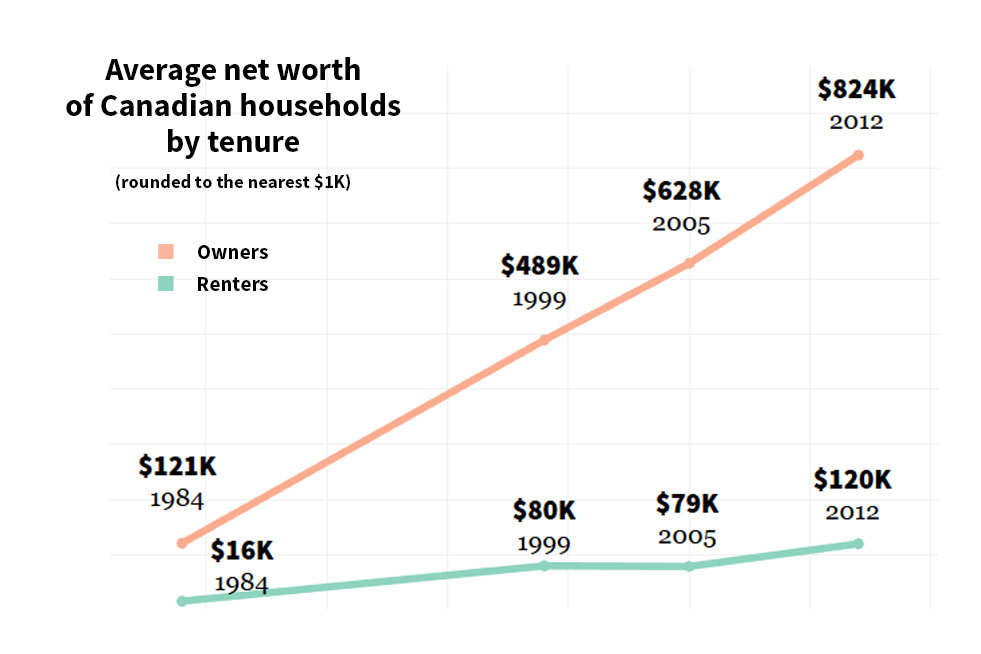
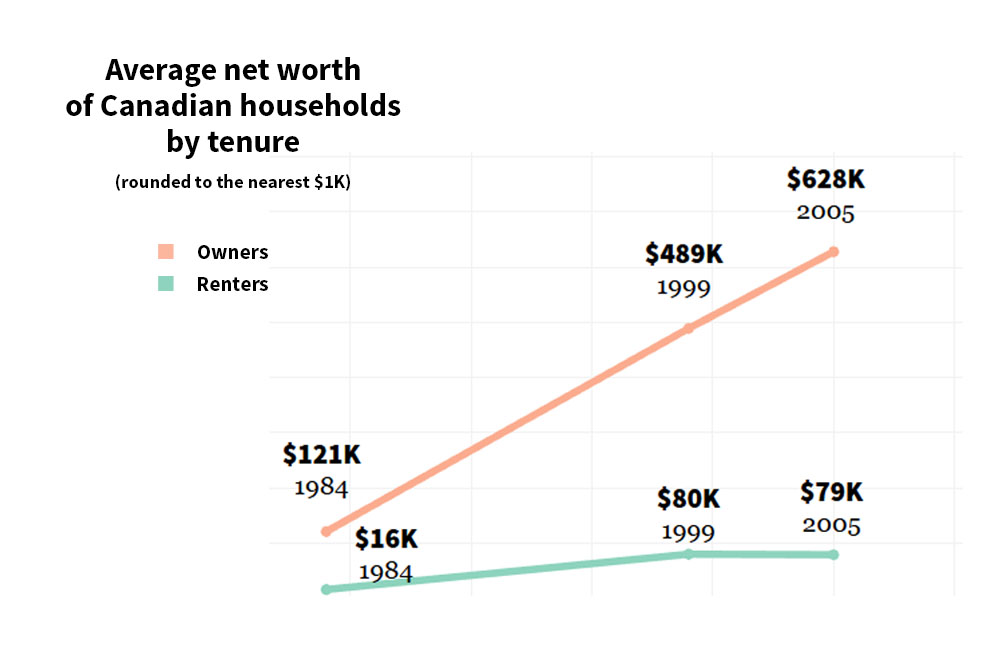
In 1984, the average Canadian who owned a home was about $104,000 richer than the average renter.
By 2012, the average Canadian homeowner was worth $824,000—the average renter just $120,000 (in constant dollars). That’s a seven-fold increase in wealth gap between owners and renters over 28 years. It’s doubtless even wider five years later. In Vancouver, roughly half of households are in each camp.
How did one half of Vancouver get so much richer than the other?
While it’s clearly not the only factor, decades of federal and provincial favouritism in tax spending have in effect pumped billions of dollars into the accounts of Canadians who own their homes, while dribbling a comparative pittance into the pockets of renters. And some of the biggest perks have gone to the very richest of Canadians. Nearly 90 per cent of the $43.6 billion in benefits lavished exclusively on home owners in this decade alone were accounted for by the exemption from capital gains tax for profits earned on the sale of a principal residence.
These graphs follow how federal tax favours have helped make Canadian home owners an awful lot richer, while renters’ savings have inched up. A future article will look at how we might restore a fairer balance.
#2. Back in 1984, renters included a fairly broad mix of society -- rich, poor and in between. On average, homeowners had net assets of $121,000; renters on average (including those in some form of assisted rental) had a personal net worth of $16,000; over the decades that followed, the wealth gap would widen dramatically.
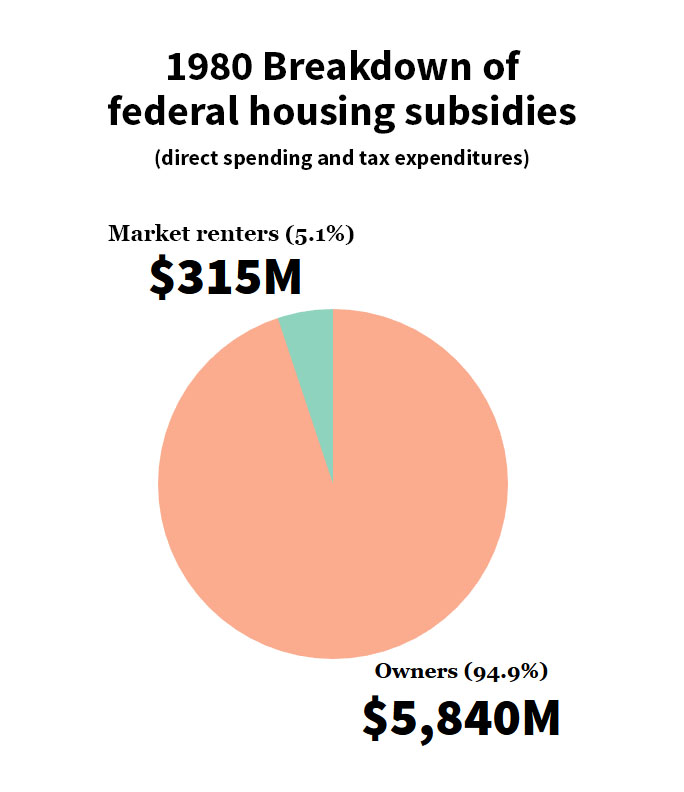
#3. By 1980, nearly 95 per cent of the money the federal government was spending to support the housing market was going to people who owned homes. Just over five per cent was allocated to private renters.
Source: Robert Dowler.
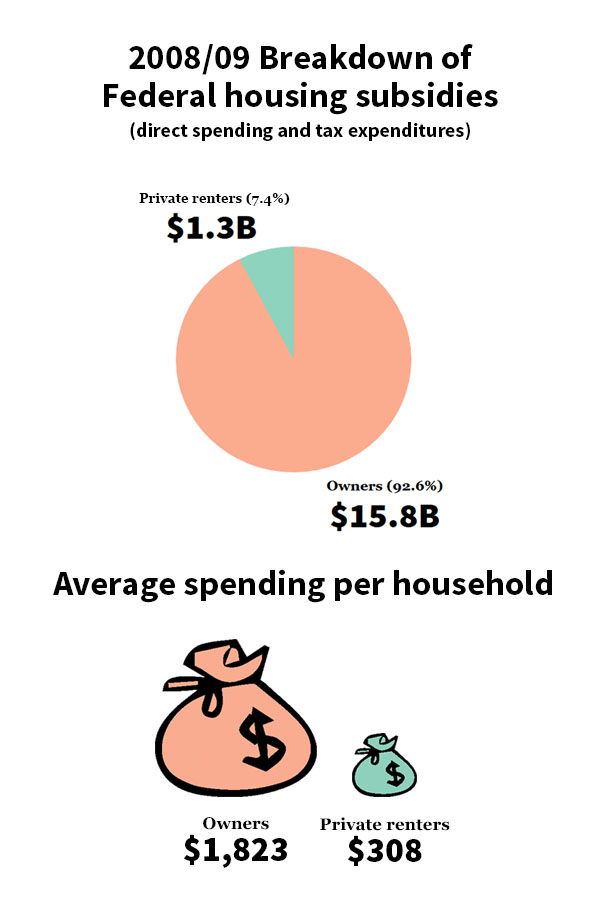
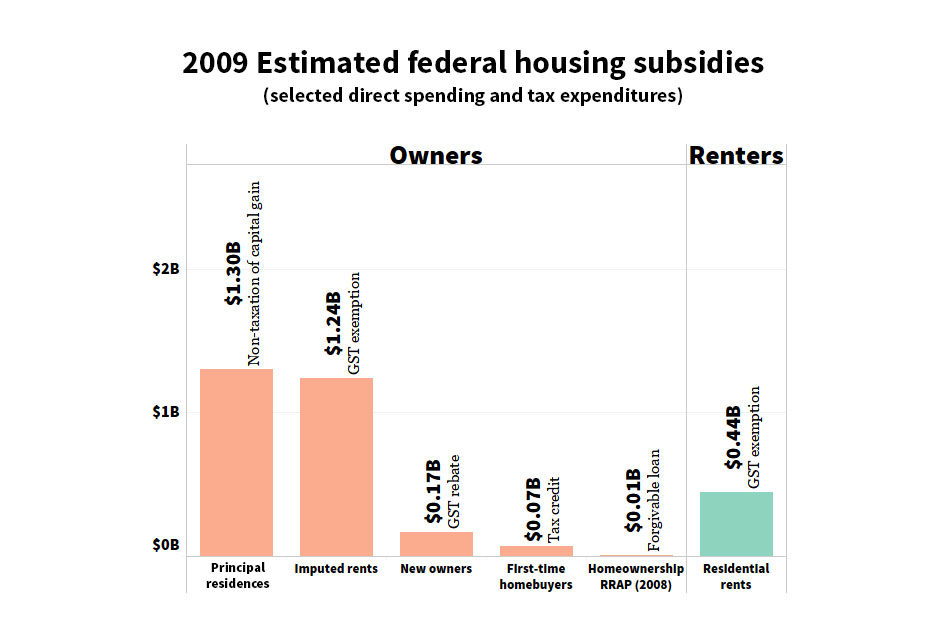
#4. By 2008/09, the imbalance in federal tax spending had eased—a tiny bit. By now only 93 per cent was going to homeowners, while renters received 7.4 per cent. But Ottawa was still directing nearly $6 in benefits to every home-owning household for each $1 dollar it gave renting households.
Source: Frank Clayton.
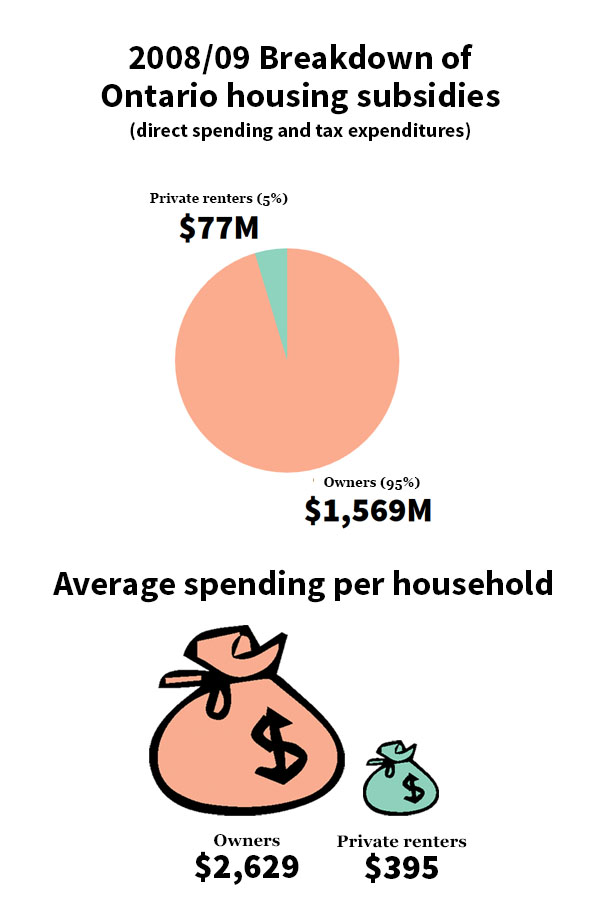
#5. Provincial governments also favoured owners over renters. Ontario’s homeowning households received 6.6 times the shelter-related benefits that its renters did in 2008/09. Overall, owners got 95 per cent of the benefit of provincial direct and tax spending.
Source: Frank Clayton.
#6. Small wonder that by the mid-‘00s, the wealth gap between renters and owners had reached $549,000.
#7. Tax-free profits on the sale of a primary residence aren’t the only extra break homeowners get.
Source: Frank Clayton.
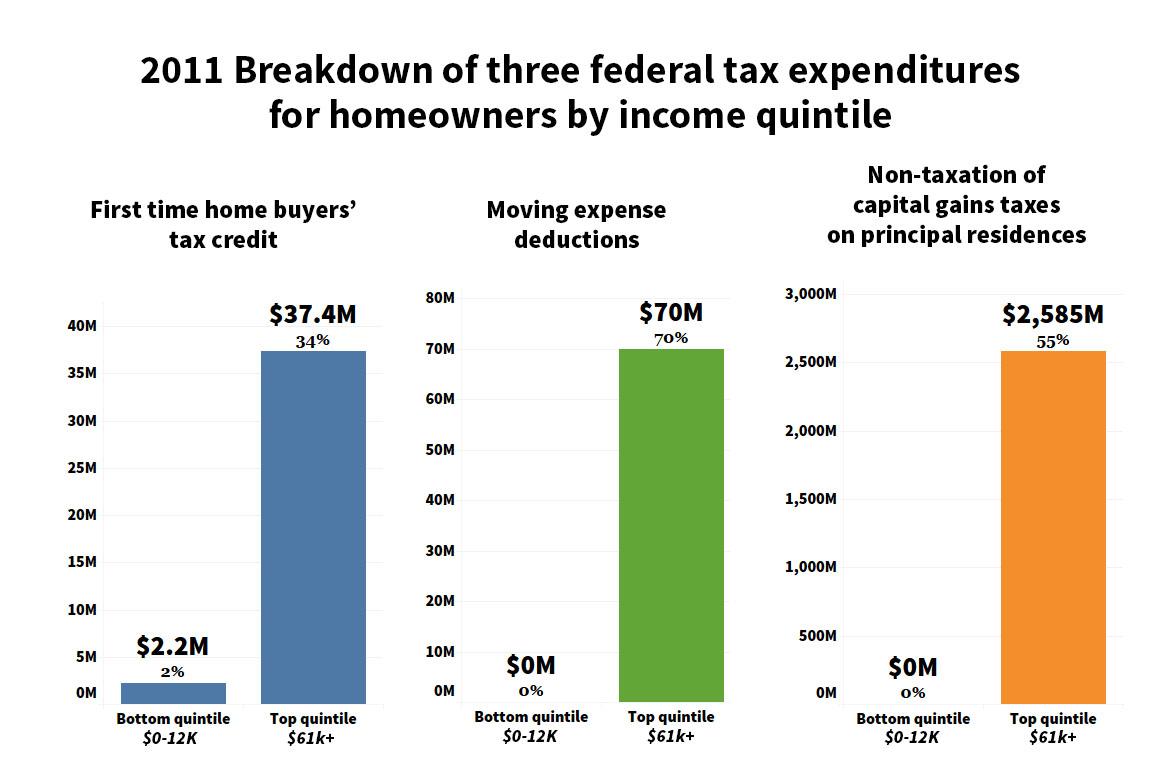
#8. The federal bias in favour of homeowners starkly benefits the rich over the poor. The poorest fifth (quintile) of Canadians by income received just $2.2 million in benefits from one of three major tax breaks for homeowners in 2011; and nothing at all from the other two. The richest one-fifth of Canadians received a combined $2.7 billion in benefit—a staggering 1,224 times as much as the poorest one-fifth.
Source: David Macdonald
#9. After 28 years of lavish tax benefits to owners and minimal assistance to tenants, by 2012 (the last year for which we could find numbers), the average Canadian home-owner worth $704,000 more than the average renter.
#3. Dowler, Robert G. Housing-related Tax Expenditures: An Overview and Evaluation. February 1983, Centre for Urban & Community Studies, University of Toronto.
Many of the numbers in the statistics and reports above were rounded. In addition, the Tyee also rounded some numbers in the visualizations for clarity.
Facts matter. Get The Tyee's in-depth journalism delivered to your inbox for free
Your privacy is important to us.
When subscribing to a newsletter edition you'll also get early notice on Tyee events, news, promotions, partner messages and special initiatives.
Further to the provision of the Personal Information Protection Act, personal information is kept confidential by TheTyee.ca and will not be sold, traded, released, shared or distributed to any other individuals, organizations or agencies without prior consent or notification.
Measures have been enacted to ensure the integrity of personal information and to protect it from misuse, loss or alteration. All information submitted to The Tyee is only available to employees or sub-contractors who are bound by agreement with The Tyee to keep the information private. E-mail addresses are only used for the purposes of Tyee-related correspondence or comment moderation.
If you have concerns related to your privacy please contact us at [email protected]
Tyee Commenting Guidelines
Comments that violate guidelines risk being deleted, and violations may result in a temporary or permanent user ban. Maintain the spirit of good conversation to stay in the discussion. *Please note The Tyee is not a forum for spreading misinformation about COVID-19, denying its existence or minimizing its risk to public health.
Do:
Be thoughtful about how your words may affect the communities you are addressing. Language matters
Challenge arguments, not commenters
Flag trolls and guideline violations
Treat all with respect and curiosity, learn from differences of opinion
Verify facts, debunk rumours, point out logical fallacies
Add context and background
Note typos and reporting blind spots
Stay on topic
Do not:
Use sexist, classist, racist, homophobic or transphobic language
Ridicule, misgender, bully, threaten, name call, troll or wish harm on others
Personally attack authors or contributors
Spread misinformation or perpetuate conspiracies
Libel, defame or publish falsehoods
Attempt to guess other commenters’ real-life identities


Tyee Commenting Guidelines
Comments that violate guidelines risk being deleted, and violations may result in a temporary or permanent user ban. Maintain the spirit of good conversation to stay in the discussion.
*Please note The Tyee is not a forum for spreading misinformation about COVID-19, denying its existence or minimizing its risk to public health.
Do:
Do not: